A Quick Way to Append Tables Across Multiple Excel Sheets and Add a Column with the Table Name in Power BI
You can append (put one table on top of another, also referred to as a union) tables in Power BI by going to the Home tab and selecting the Append Queries button, then by selecting the tables you would like to put together. However, one problem I encountered when completing the Preppin' Data 2023 Week 1 Challenge was that it asks to create a date column using the column with the table names (which would be the month). This column is automatically generated when you append (union) tables in Tableau Prep, however not when it is done in Power BI.
Here is a quick step-by-step guide on how to append tables and create this column:
- After you input the dataset into Power BI, select all of the tables and click transform data.
- Select one of the tables and right-click on the Navigation step that appears in the Applied Steps Pane.
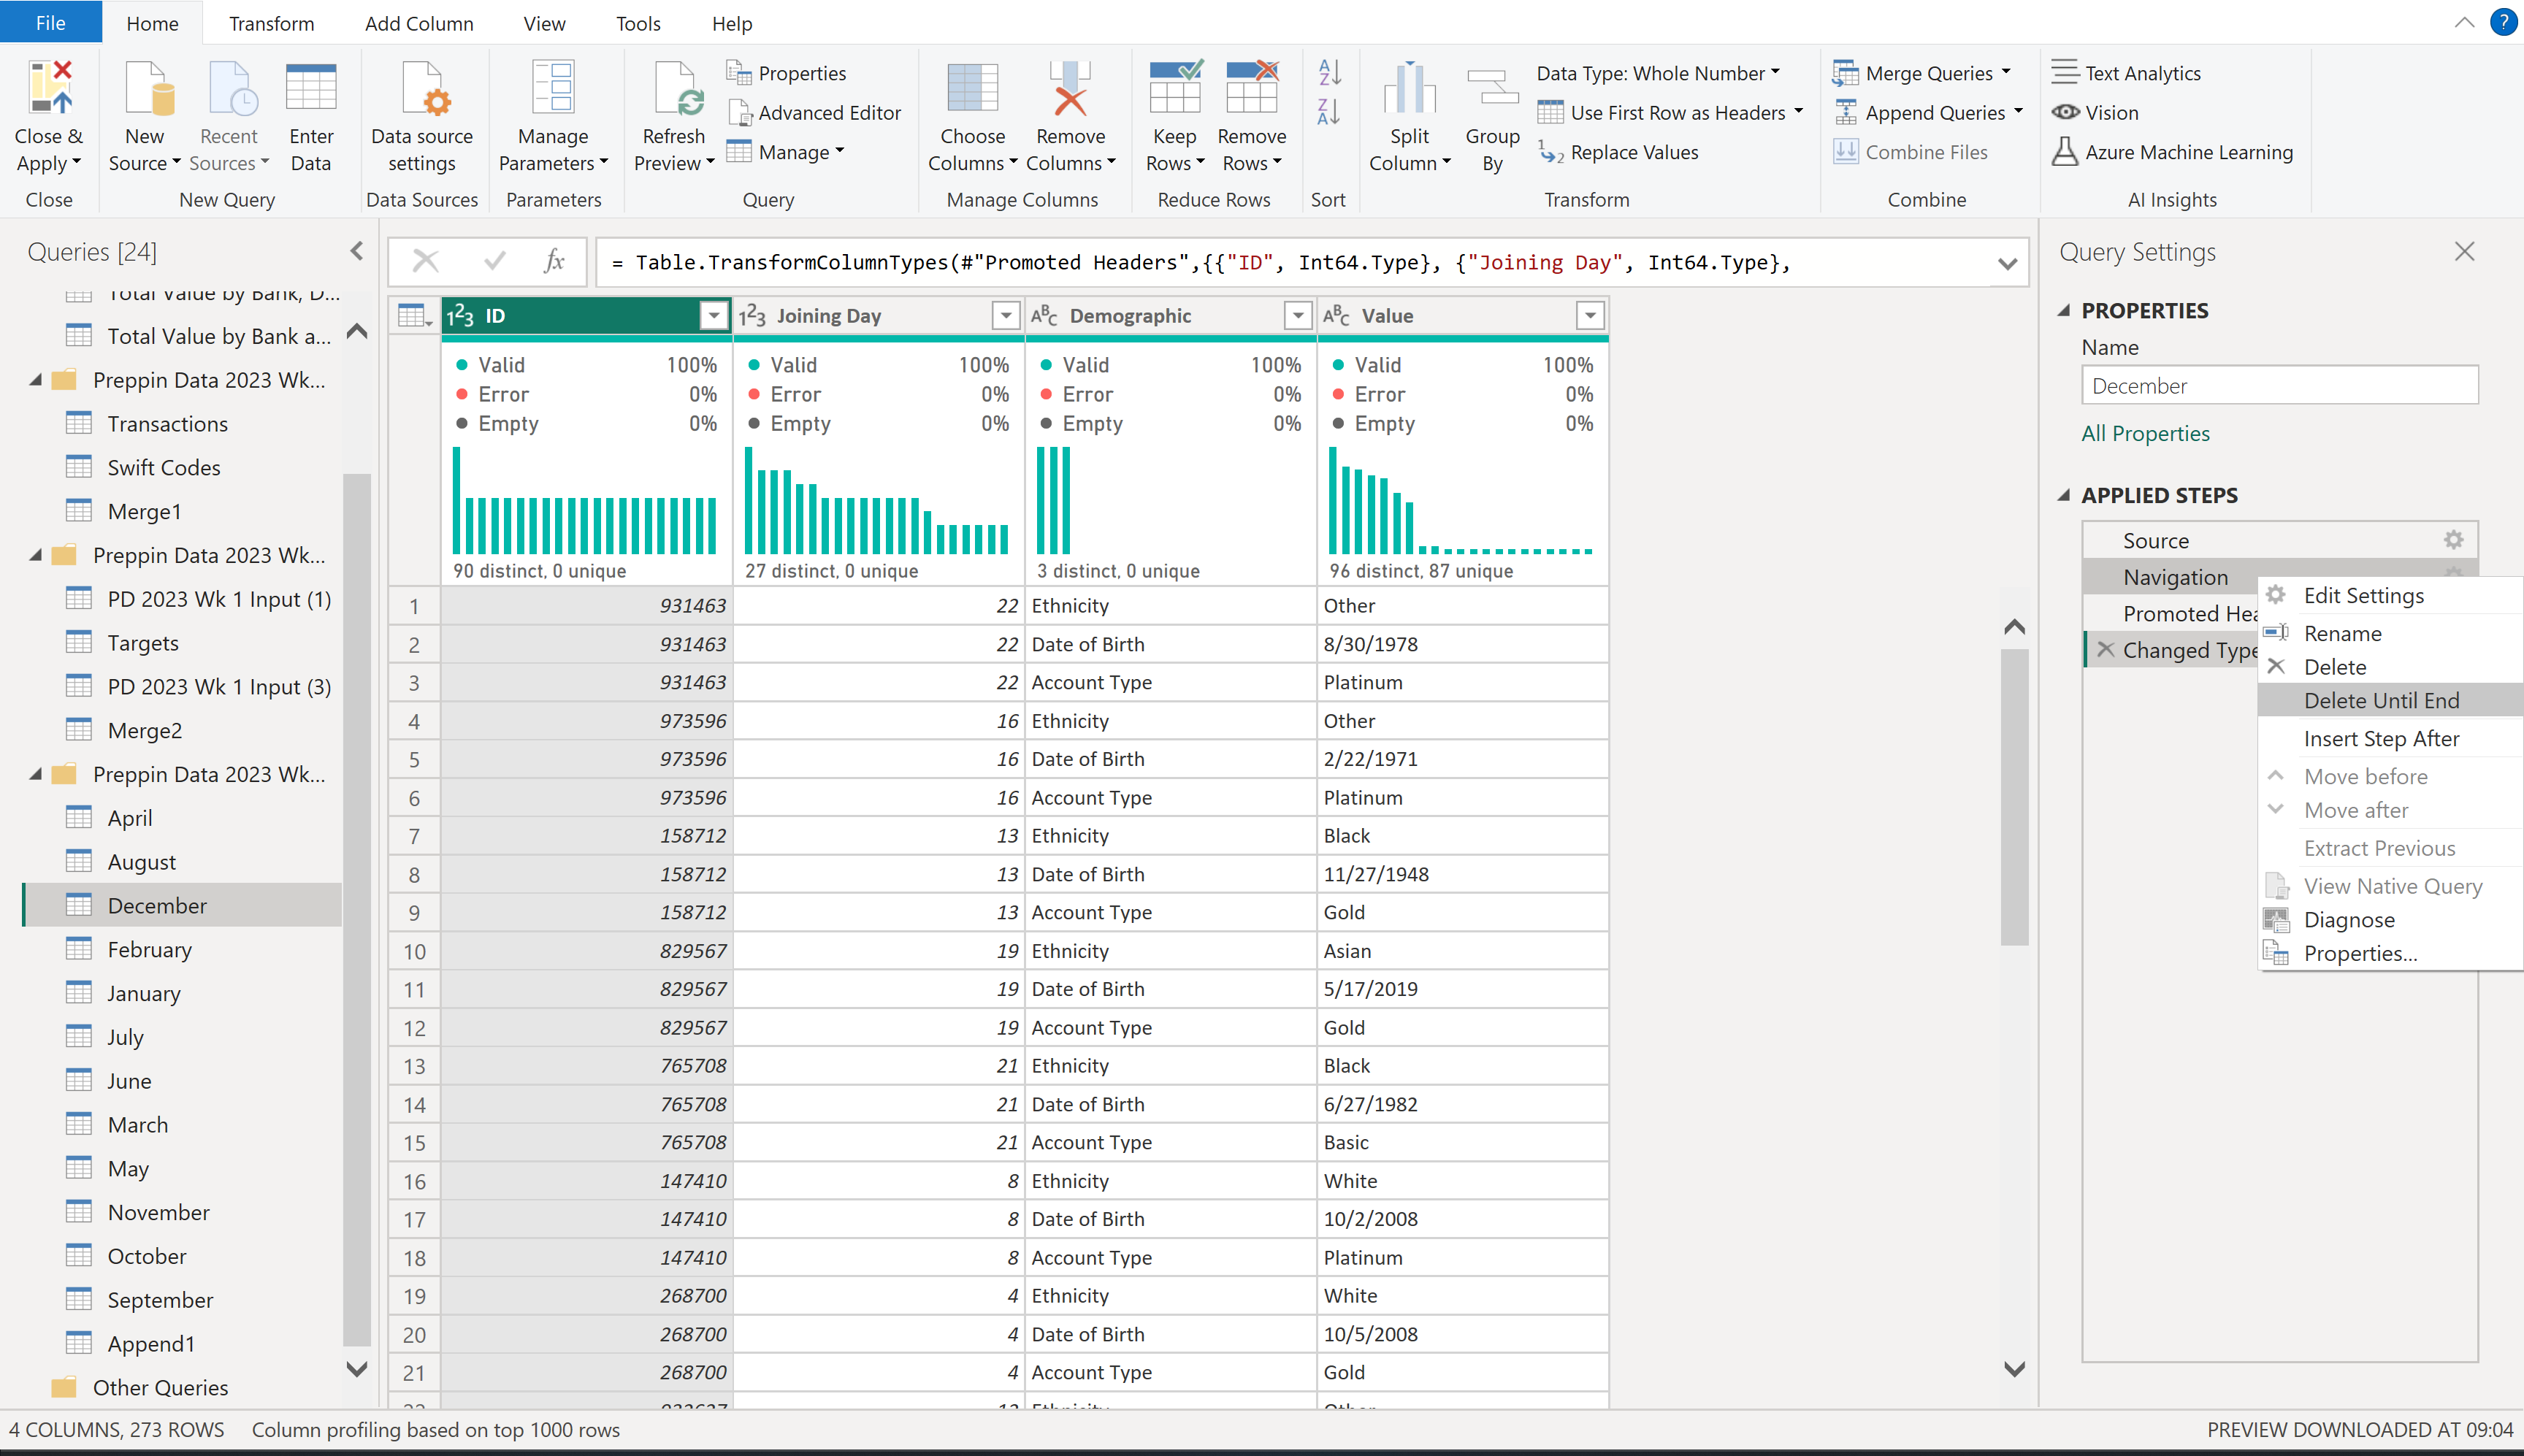
- Select Delete Until End.
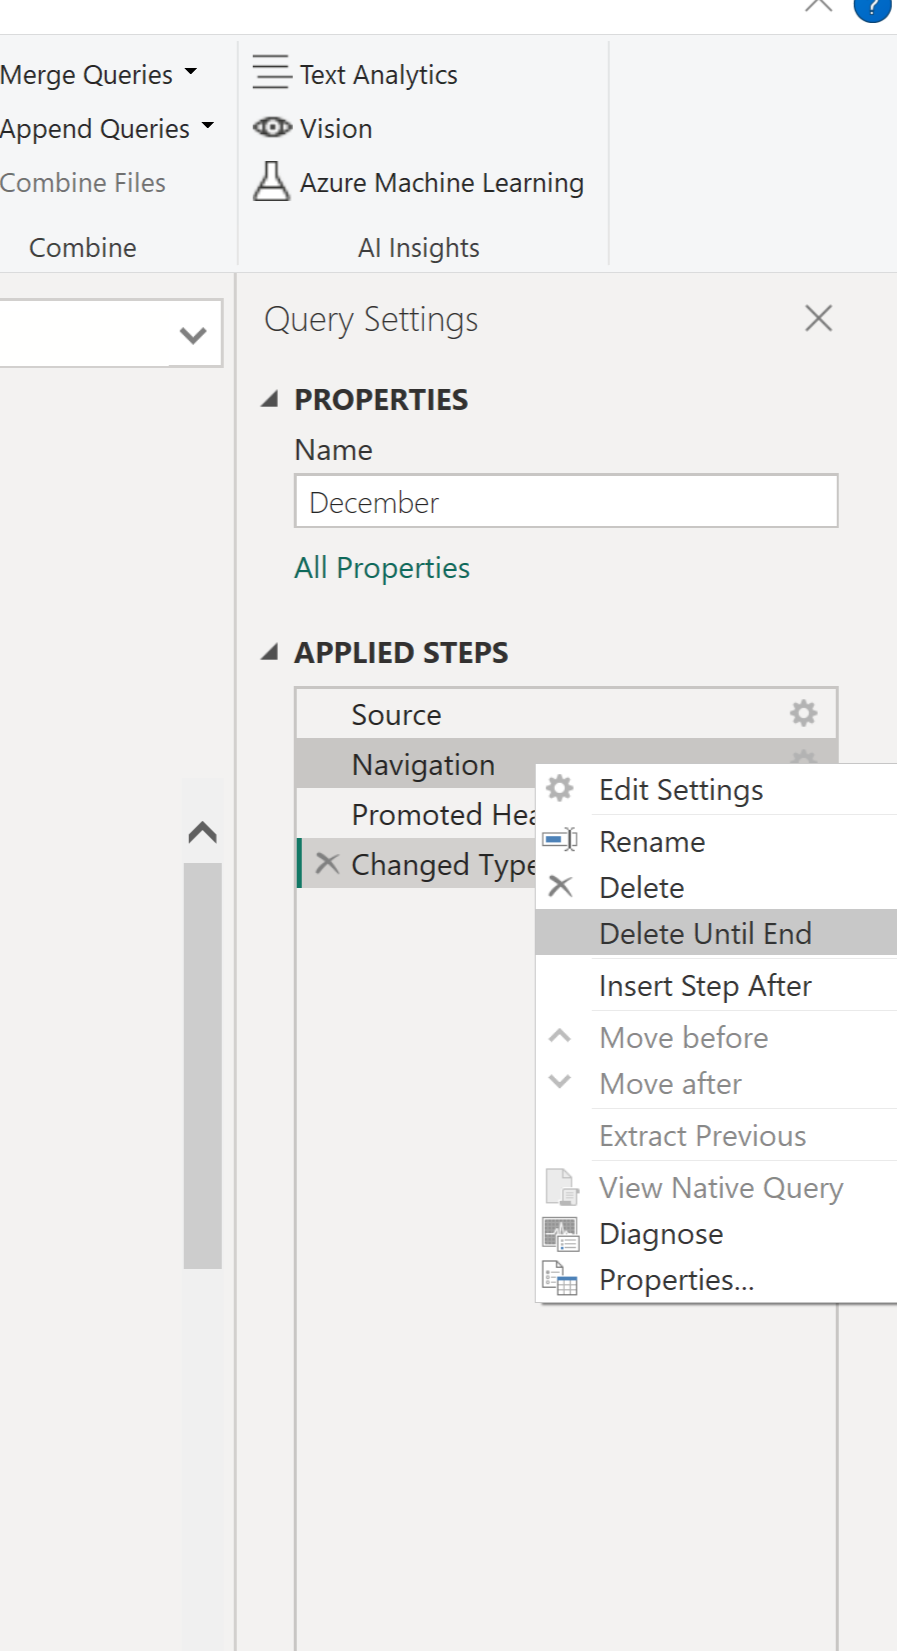
This is what the table should look like after this step.
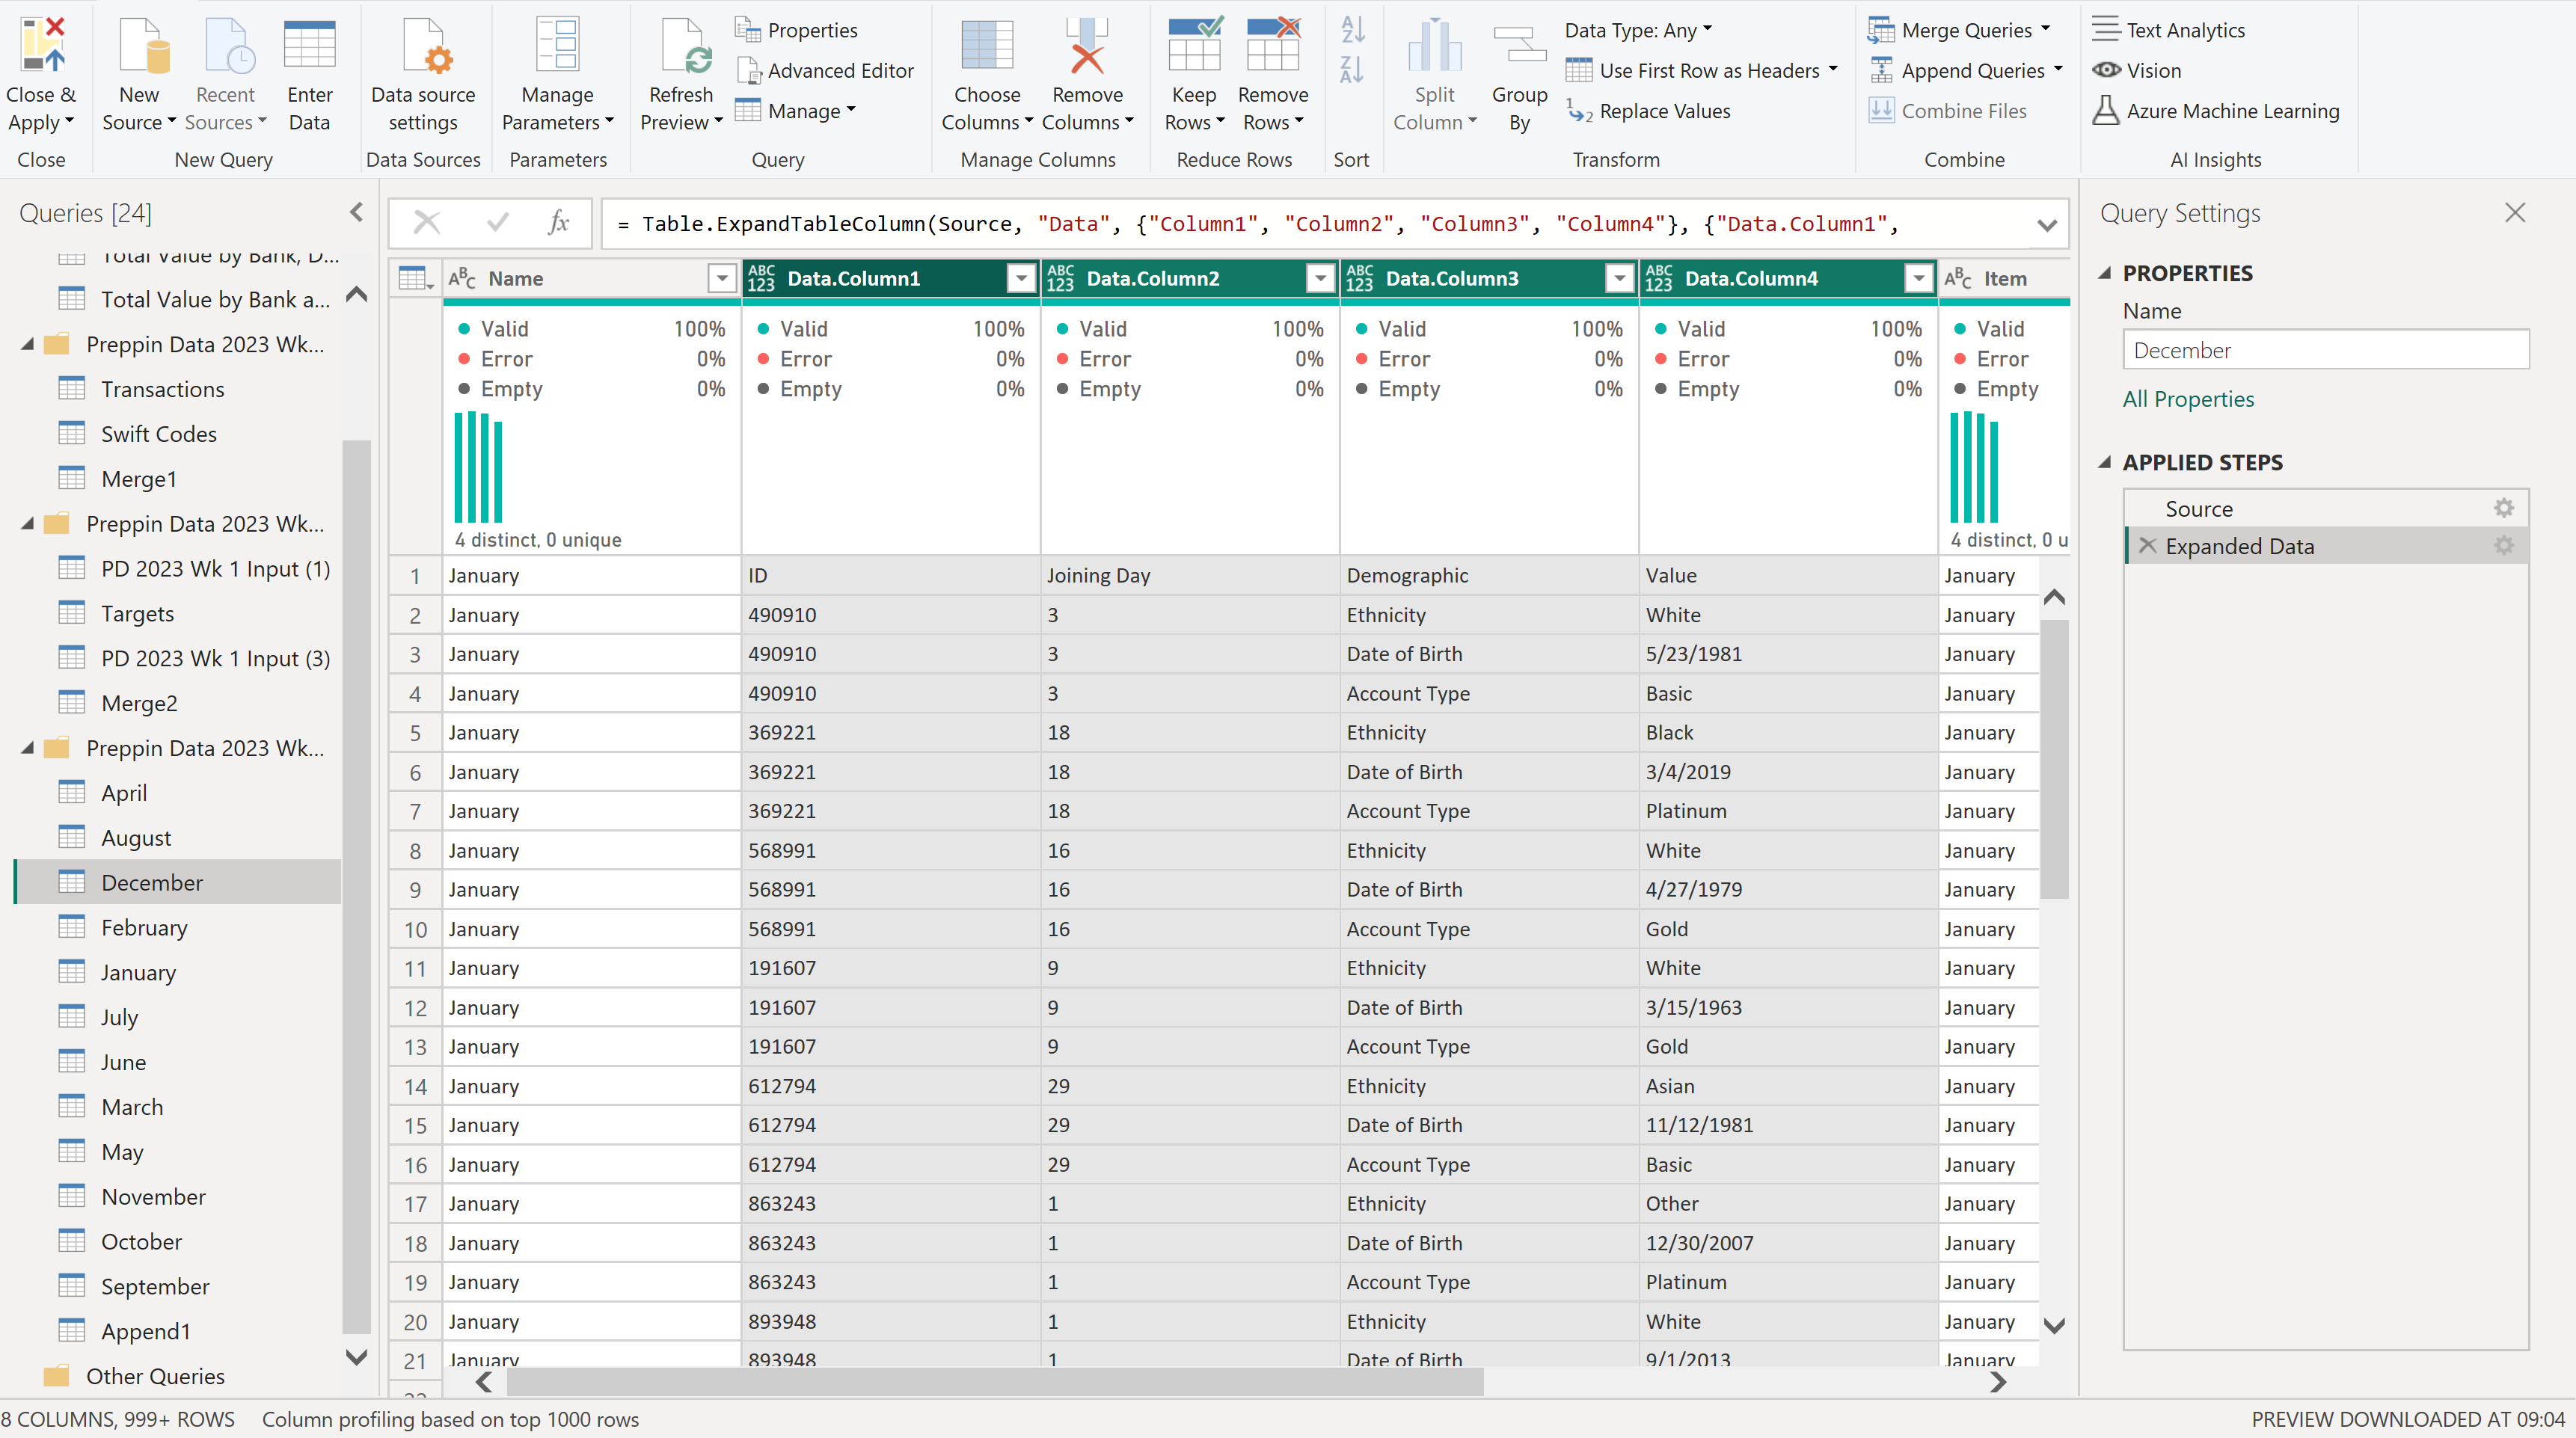
- Select the expand button on the right side of the Data header to expand the data.
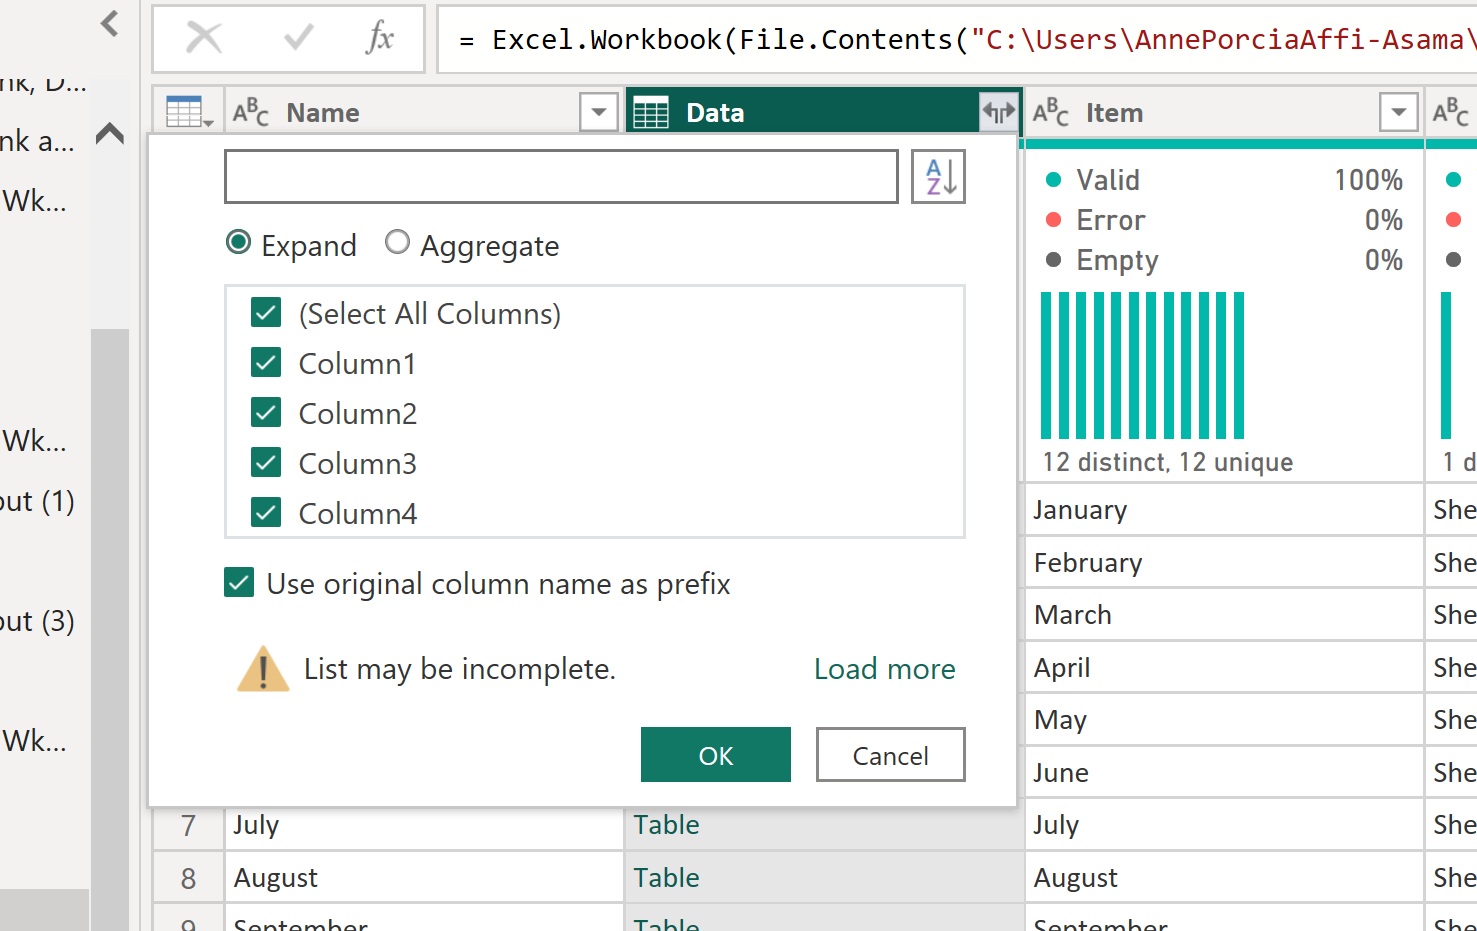
This will result in a single table with all of the separate tables stacked on top of each other along with an additional column showing the name of the table that data came from.