When using multiple measures in one chart in Tableau it can very easily become overcrowded and difficult to read. However doing so can allow for a good visual comparison between two measures in one data set, for example, comparing sales and profit. Here is some guidance in how to approach creating these kinds of charts to ensure it is best understood by the reader.
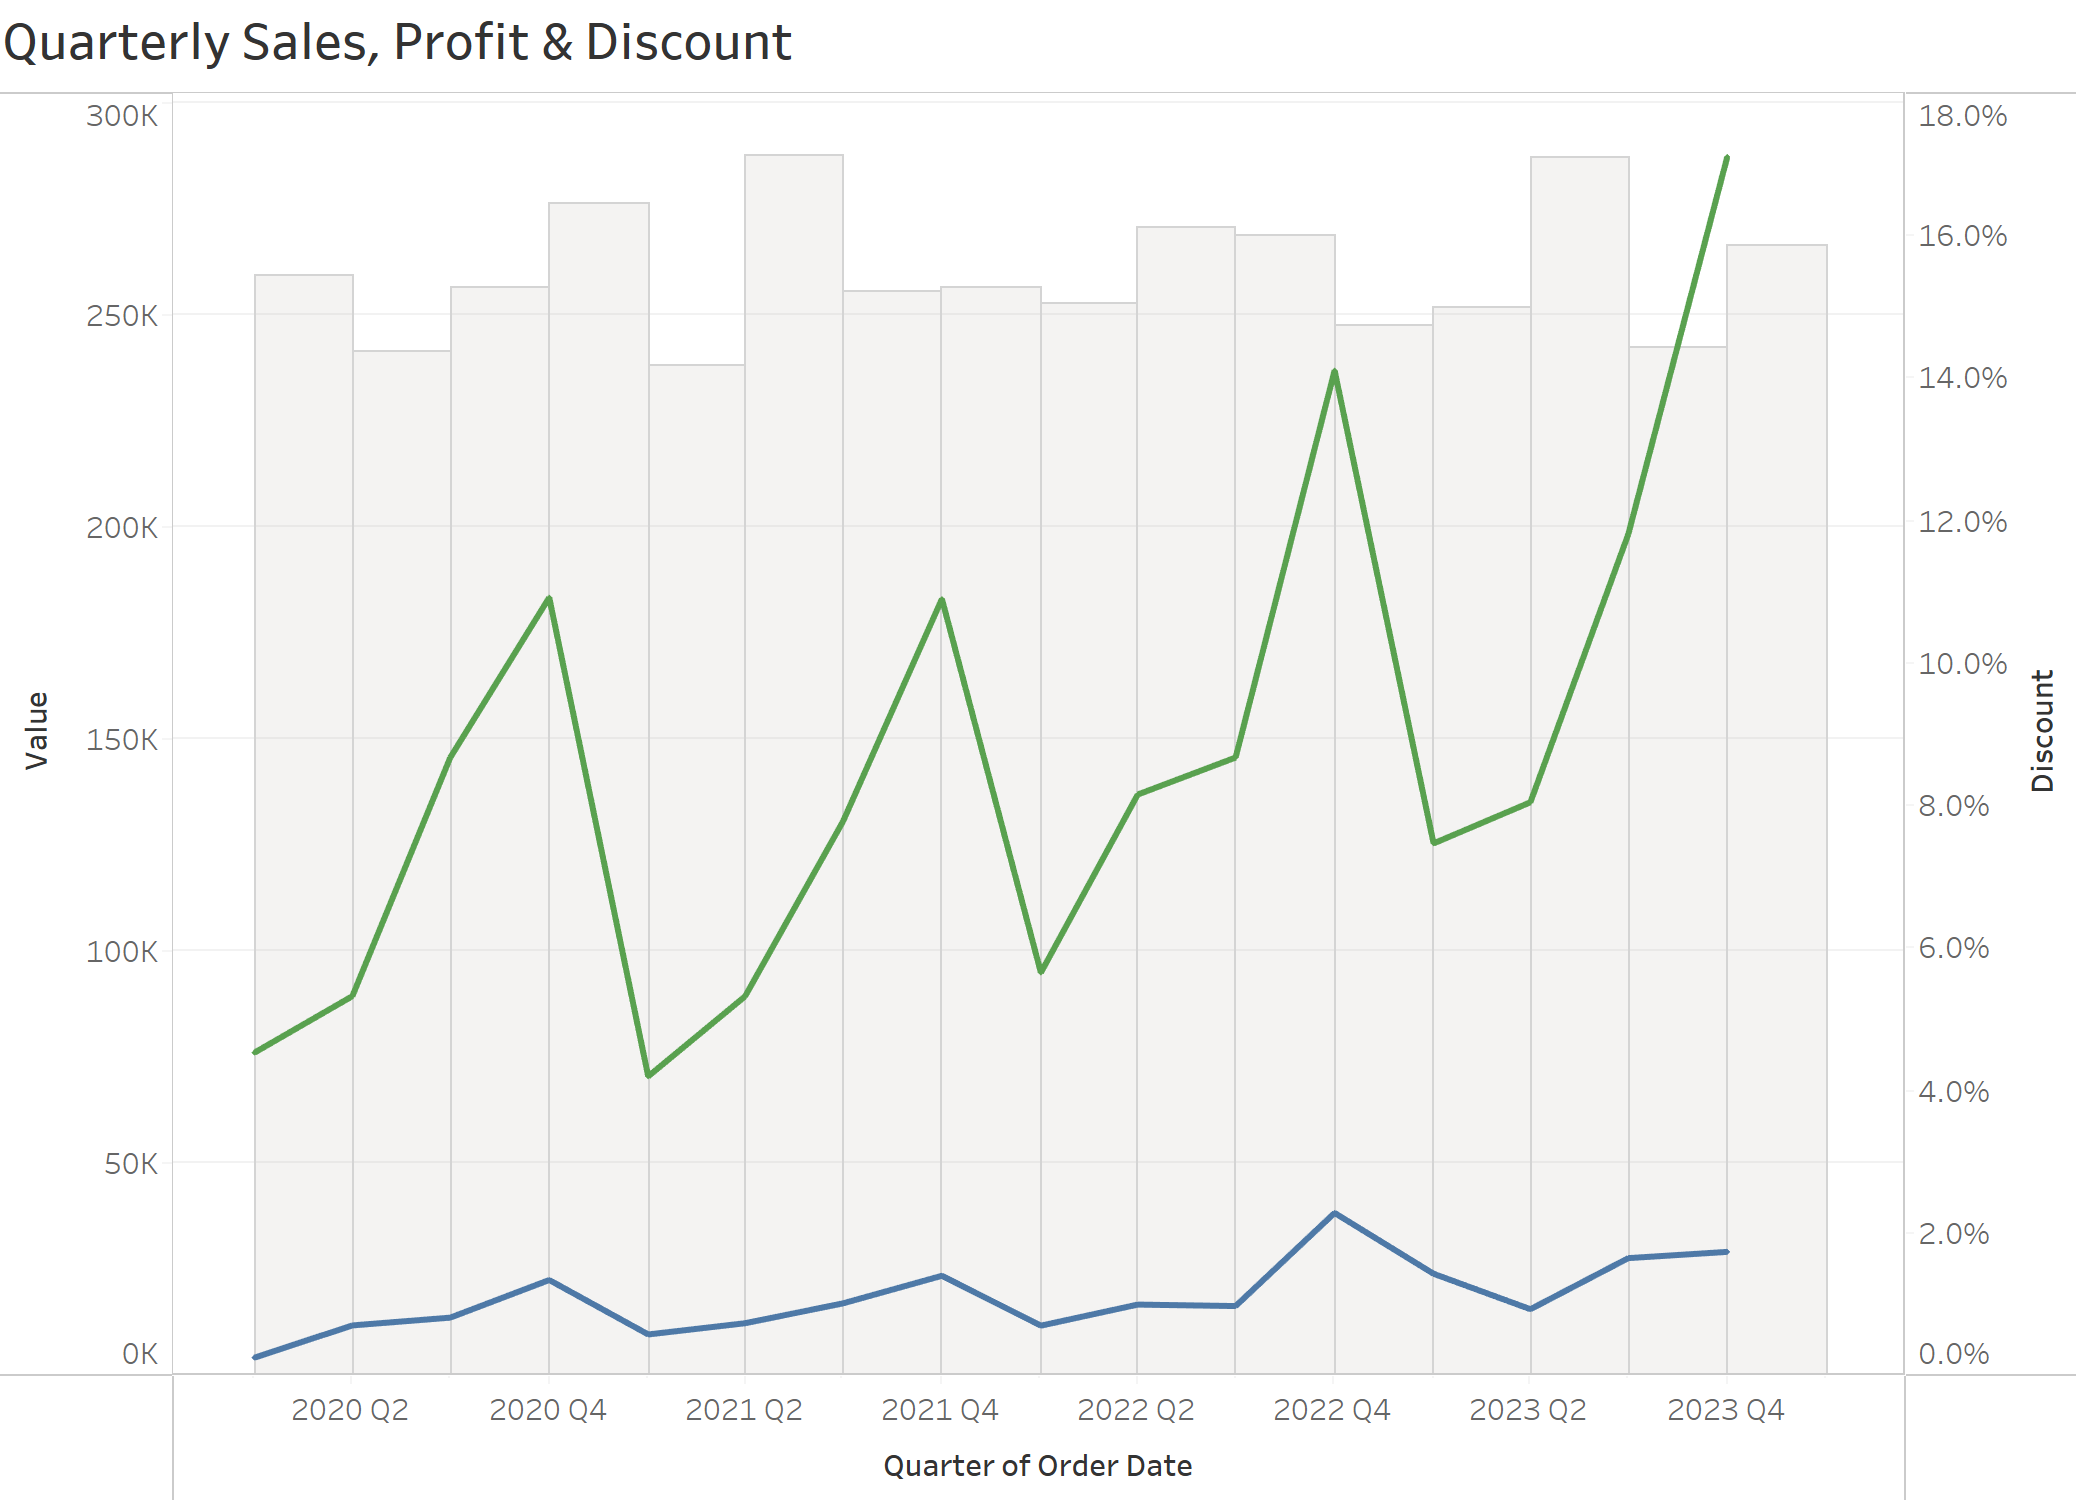
- Make sure to emphasize most important values for key insights
While you may want to show all measures, some will more important than others, for instance in the example above, the key measures that are being compared are Sales and Profit. These measures have been emphasized by making Discount a neutral colour and reducing the opacity to make it translucent. However Sales and Profit have remained bold colours to capture the users attention. If the user wants to then look further at the Discount trend then it has made possible for them to do so.
- Layer different chart types but make sure the tooltips in the key measures are accessible
Multiple chart types can help differentiate between measures however when they are layered on top of each other they can prevent the user from selecting/hovering over data points in other measures. Make sure the key measures are brought to the front so that the user can access the tooltips. To do this, right click on the header showing the key data and select 'Move marks to front'.
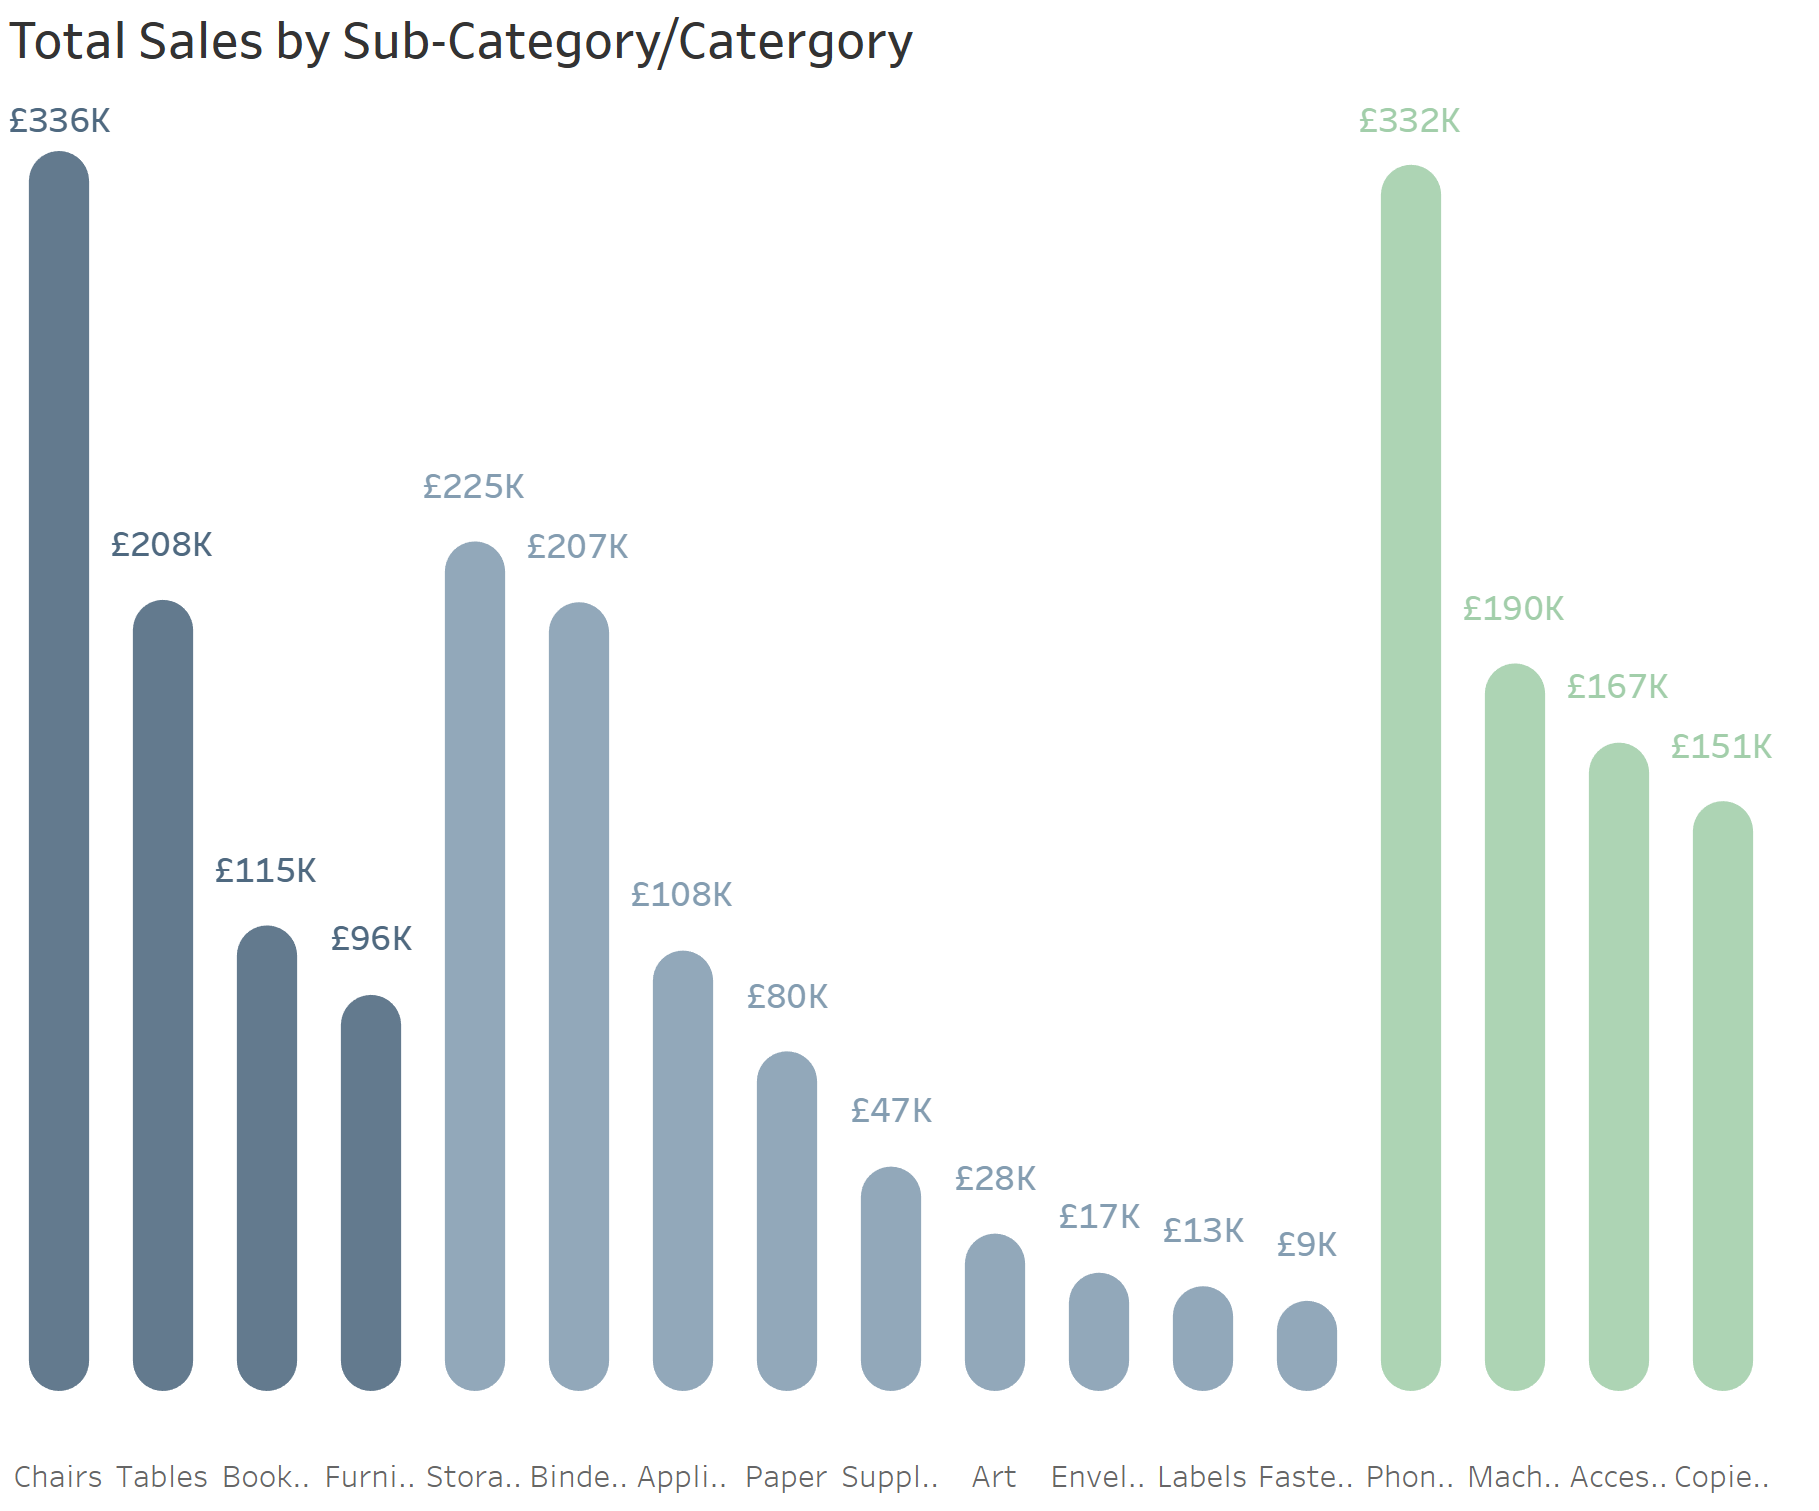
- Prioritise readability over design
This applies to all charts you may create. While the chart below may be visually pleasing, it would be better to have the axis available for the reader instead of having individual labels. There is a high number of sub-categories shown causing the labels to overcrowd the chart.