


Before getting into what analytics architecture is, we have to talk about what data analytics is.
Data is all around us in various forms. So much data is collected about us on a daily basis; when you tap in on the bus or train, when you search for things on google, when you buy a coffee at Starbucks, all that information is collected and stores in some sort of database. Of course this doesn't mean that your personal data is always being collected and we know that there are loads of data protection laws and policies that prevent harmful use of the data collected, but some form of data is always being collected. And this is a good thing. TFL needs usage data to make the transport system better; Starbucks needs data to offer the best coffee for that much needed morning pick up.
Just having all this raw data though is pretty useless unless there's a question we need to answer. For example TFL might want to know if they need to increase or decrease the frequency of a specific train route, so they turn to the data to see what type of traffic that route gets and if there are peaks at certain times of the day. So the data is analysed and we look for answers to the question.......and then we have to understand the data, which is a whole other ball game. During COVID we were inundated with lots of graphs, charts and maps like the one below. Very pretty (some of them) and very complicated to understand. All these charts and things come under data visualisation.

Data analysis usually lies within the IT department. I'm sure everyone is familiar with having to go to the IT department, and submit a ticket when you have a problem or if there's some data/information that we need. We also know that getting a response can take forever. These days organisations are changing and everyone within the organisation is getting direct access to the information and data they need to be more efficient in their tasks.
Modern data analytics is essentially bringing data analysis closer to everyone and removing that barrier that used to be there. Now, you don't need to be a coder to do your own analysis. The architecture then talks about the design of the structures that allow this data analysis to occur. It follows a general pipeline:
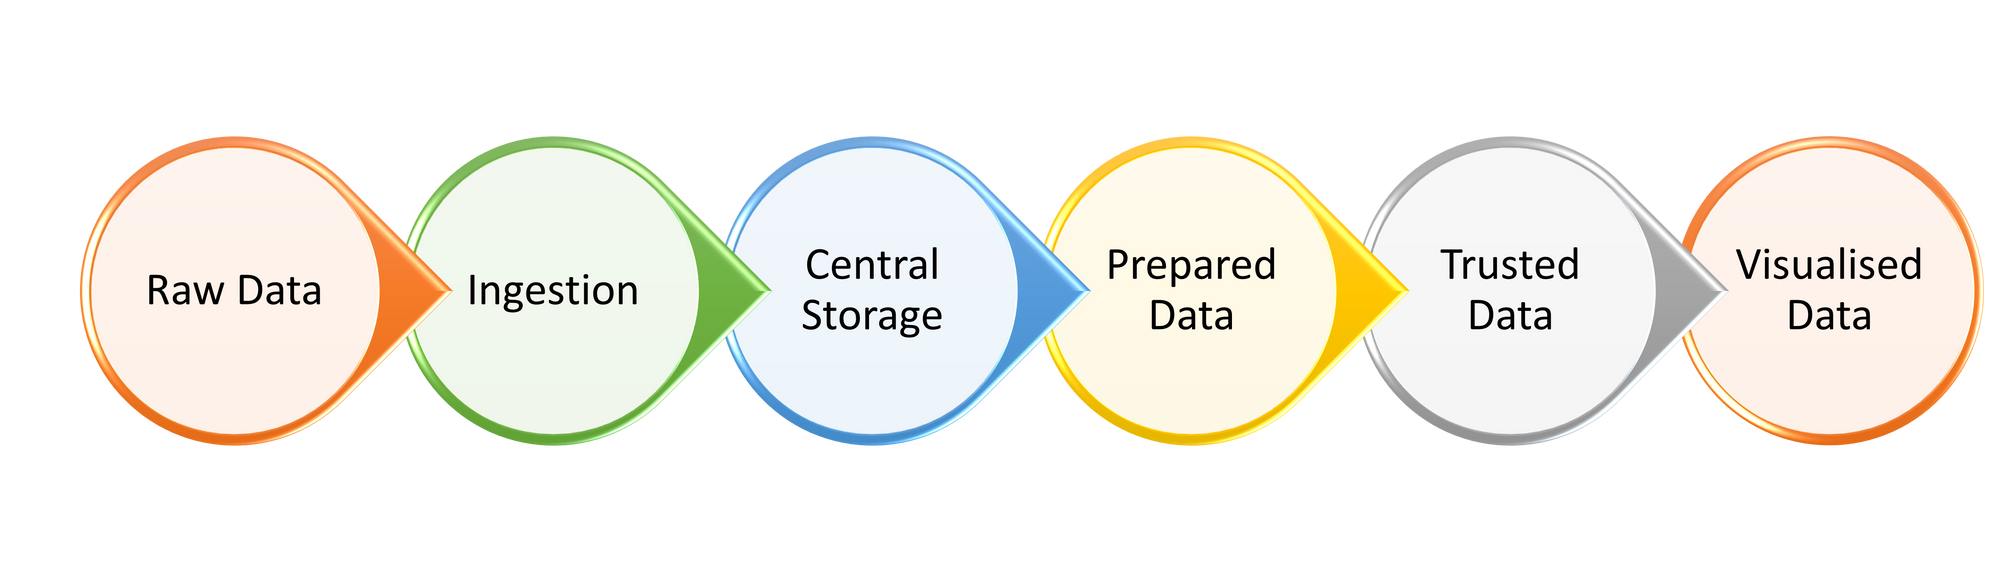
Raw Data - Collected from various sources in various formats such as excel files, organisation databases, the internet, etc
Ingestion - All this raw data is brought together and connected. These programs can take in various types of data and transfer them to a storage location
Central Storage - This is where the data you've collected is stored till there is need for it.
Prepared Data - When you have a question you need answers for you won't need absolutely all the data you've collected. In this stage, the data will be cleansed and prepared bringing out only the sections requested and not absolutely everything that you have.
Trusted Data - This stage asks the question "is the data you are about to use in your analysis and visualisation trusted?" This will have come from having prepared the data before, reviewed it, and operationalised it in the previous stage.
Visualised Data - Now that you have the data you need, various analyses are run and and you can present your data in very pretty graphs and charts. YAAY!!
So this is the modern analytics architecture. It is important to note that not all steps are needed at all times, it depends on the raw data that's being collected and the programs you're using. For example, your raw data can be put straight into a program that will be used for all the steps till visualisation.