


Today we had to webscrape the NRL website to get information about two teams. We needed all the games from 2017 - 2022, the player stats, and play by play commentary. Safe to say I did not finish all of that!!!! It was so much
First of all, the data was javascript not HTML so that was a major road block. I tried to regex it all out column by column but that was very slow. Our coach then gave us a workflow that helped and I was able to make a functional workflow.
Let me take you through this.
First, I downloaded all the team data from the website (I only downloaded the games where my two teams were home). I just changed the team code and the year in the URL.
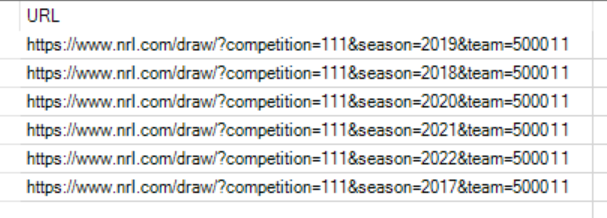
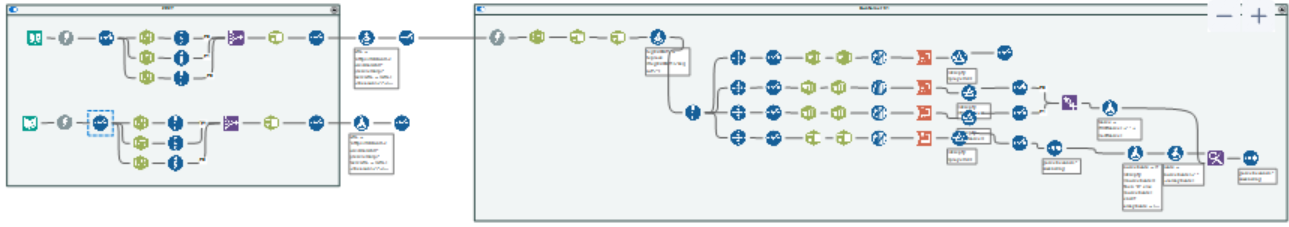
I then used the download tool to pull this information out. Using regex, I pulled out what round the game was, what team played, the home team final score and the away team final score. I then used this information in a formula tool to make new URLs so I can get the data for each match played.

The rest of the workflow was cleaning and transforming the data so that it was in a logical format that was easy to interpret.
Although this was hard, I really enjoyed it. Alteryx is like a 3000 piece puzzle basically.