Feedback from DS5 was that my topics were too depressing, so this week I’m doing my best to find more interesting, fun data sets to work with. Be sure to read all of the blog posts from day 1; the team did some outstanding work!
Now onto day 2.

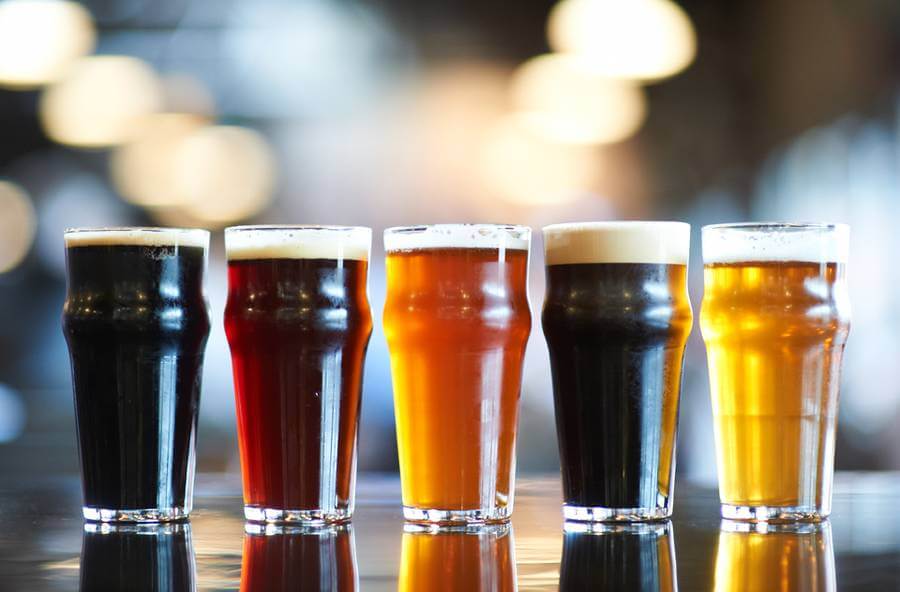
Anyone that knows me knows that I like a beer or two. Today, the team will do analysis on beer and wine data. Four of them will work with a beer database, four with the wine reviews. As always, data prep will be done in Alteryx and visualisations in Tableau.
The data comes from two data sources:
- BreweryDB.com
- Wine Reviews (via Kaggle)
That’s it! Good luck to the team!
