


The second challenge of dashboard week was to produce a dashboard using IMDb data, focusing on some specific topic in the world of cinema. In my case, I chose to focus on language: what languages are films in? How has this changed over time? How do films in different languages differ in genre and popularity (IMDb rating)?
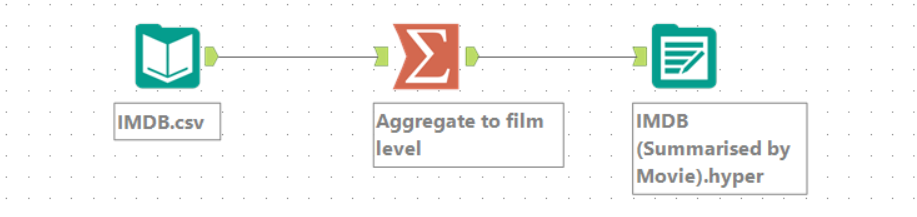
The initial data contained a row for every listed actor in every film in the IMDb database. This didn't require much data prep, but since I wasn't interested in individual actors, I aggregated it in Alteryx to the level of the film, bringing the number of rows from around 6 million to around 500,000.
Next, I began considering what questions the data available could answer. Questions like:
- What are the most used languages in the cinema of each country?
- How has the language makeup of each country's cinema changed over time?
- Does the distribution of languages depend on the movie genre?
An initial mockup in Tableau, below, split the view into an insights (explanatory) section and two exploratory sections.
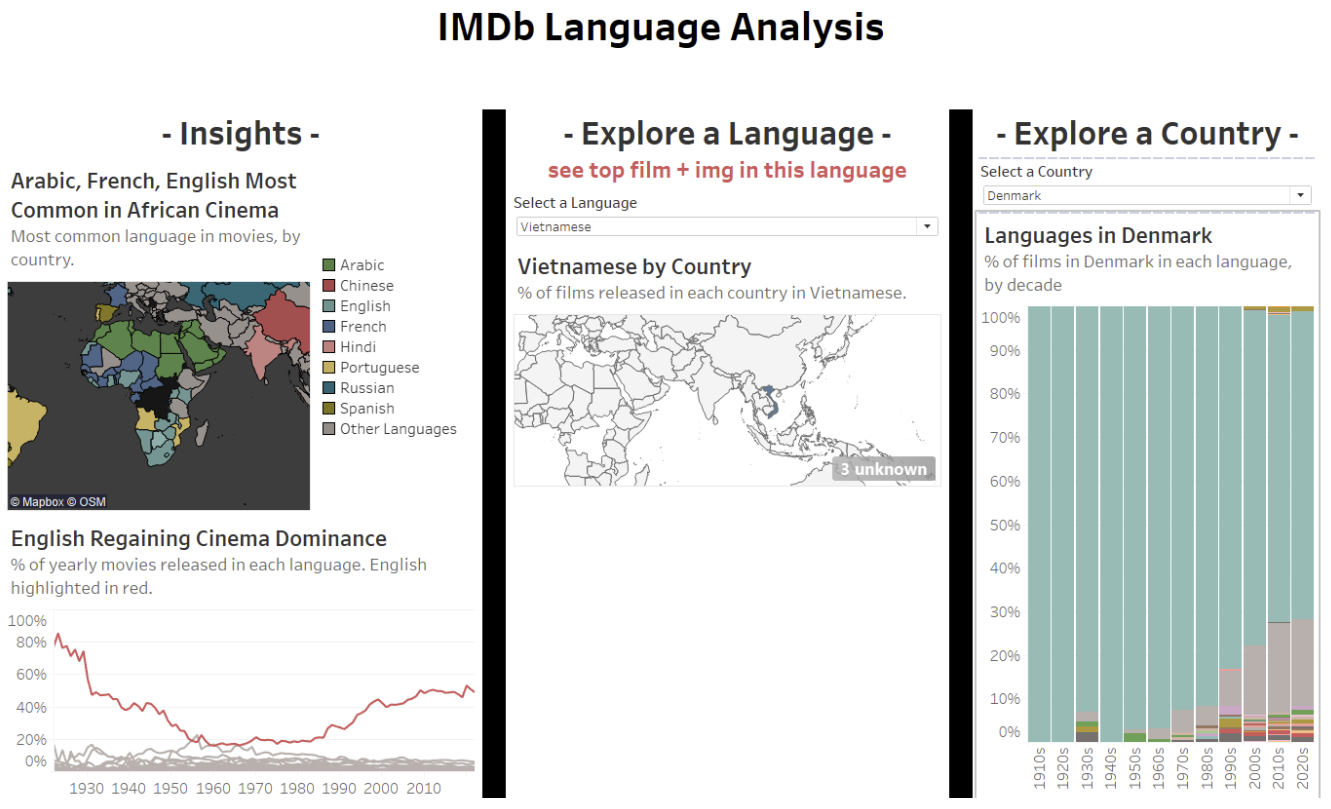
As I explored the exploratory side though, I increasingly found insights I wanted to present, so shifted my approach to be fully explanatory. As my number of charts increased, I also decided to split my dashboard into three, with navigation buttons connecting them.
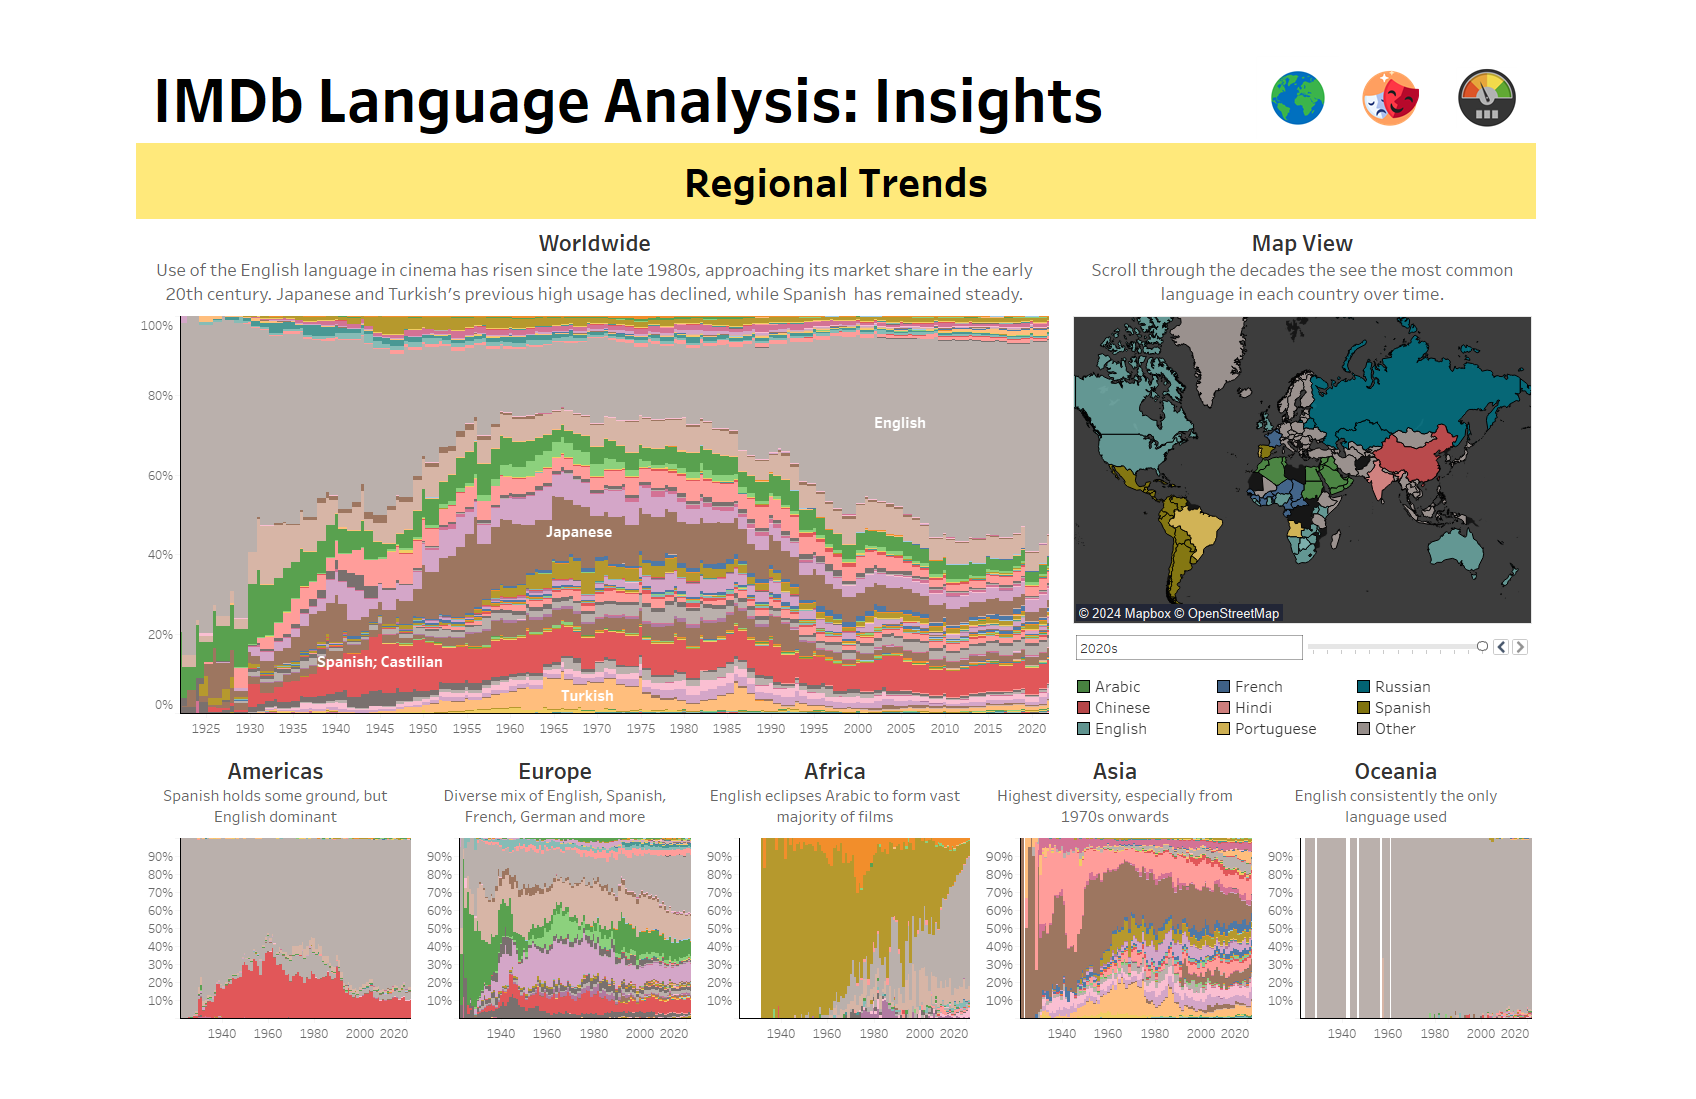
My first page, looking at regional trends in language use, used stacked bar charts to show the language distribution by year. While the overall data was hard to draw insights from (apart from the growth of English), the continent-level graphs had clearer patterns, for example the replacement of Arabic cinema with English cinema in Africa, and the increase in diversity in Asia.
Even finer-grained detail, looking at the country level, revealed more patterns, such as Persian cinema overtaking Pashto cinema in Afghanistan:
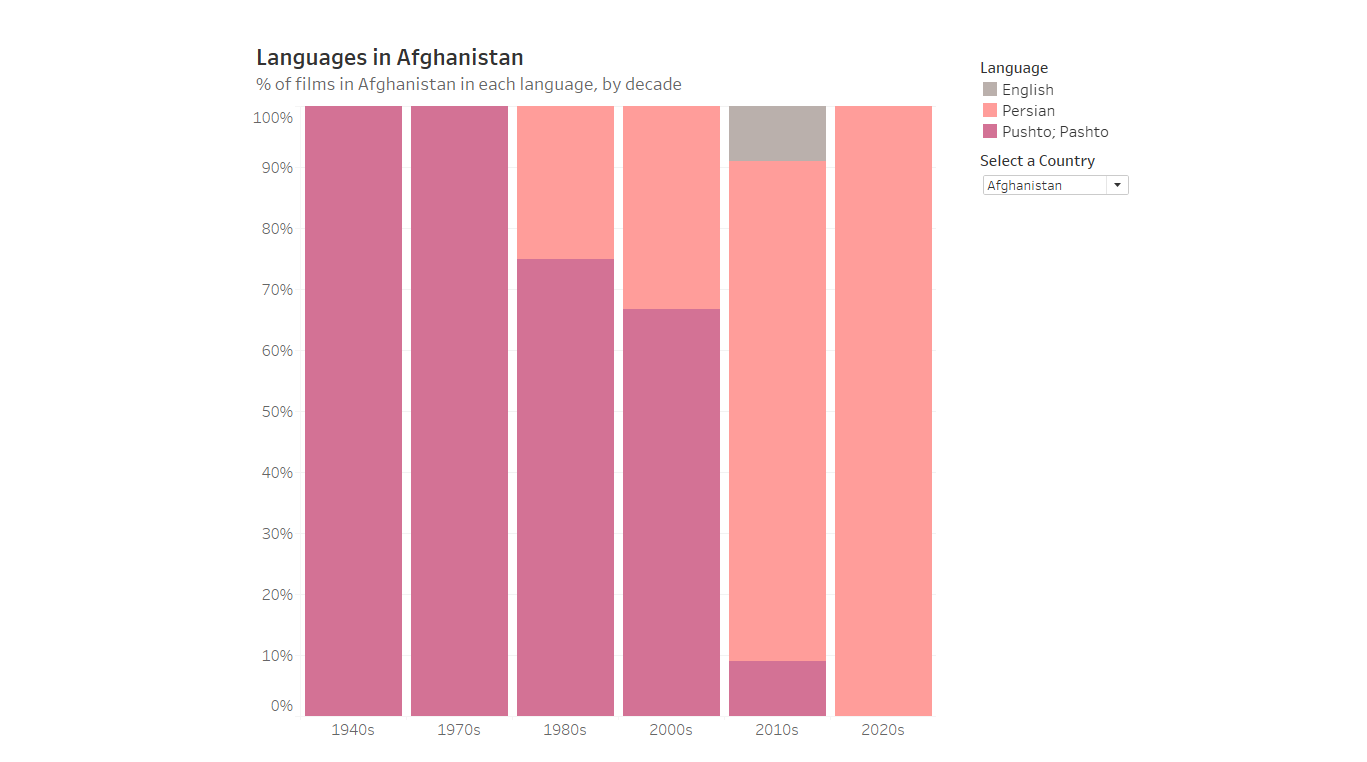
However, for simplicity I kept the analysis to the continent-level. As well as geographical trends, I also looked at genre and ratings, which can be accessed from the icons in the top right. The dashboard can be seen on Tableau Public at:
https://public.tableau.com/app/profile/andrew.tobin3436/viz/IMDb_Languages/REGIONAL?publish=yes