


Aggregation is an important part of data preparation, and this is achieved in different ways depending on the data prep software used. While in Tableau Prep this is achieved by adding an 'Aggregate' step to the flow, Power Query makes use of the 'Group By' function (under the Home tab).
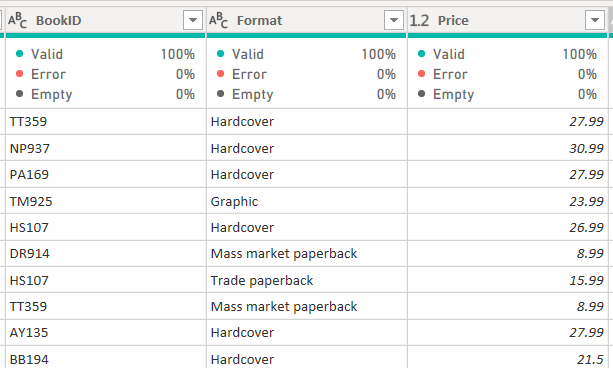
The Group By function allows you to choose a field to aggregate by, and another field to get values from. For example, suppose we have a table of books for sale, with a field for the book format (e.g. hardcover) and a field for the book price. We can use aggregation to find out the average price for each format.
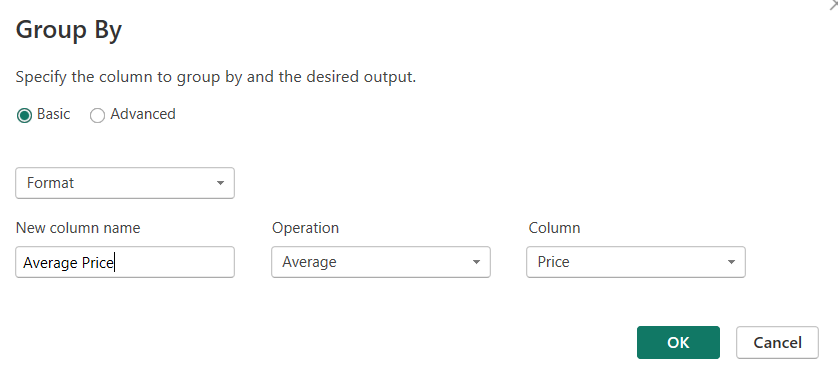
Using the Group By function, we can select the category we want to aggregate (Format), followed by the values we want to get for each aggregated category (in this case, the average of the Price field).
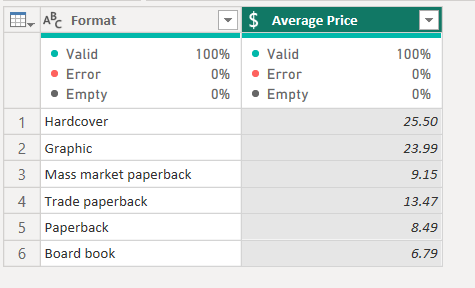
This gives us the desired output, shown below.
If we want to aggregate based on more fields, or to output more value columns, we can use the Advanced option of the Group By function.
While this can be done solely using the Power Query GUI, it can help to understand the syntax of the underlying M-language command. The command used for the example above is as follows:
Table.Group(#"Promoted Headers", {"Format"}, {{"Average Price", each List.Average([Price]), type nullable number}})
We can break this down into the following elements:
- Table.Group() - this is the name of the Group By function.
- #"Promoted Headers" - this refers to the previous applied step in the prep.
- {"Format"} - the first argument to the function names the field used to group the data by.
- {{"Average Price", each List.Average([Price]), type nullable number}} - the final argument contains three elements: first, the name of the new field; second, the function and column determining what data is aggregated and how; and third, the datatype of the new field.