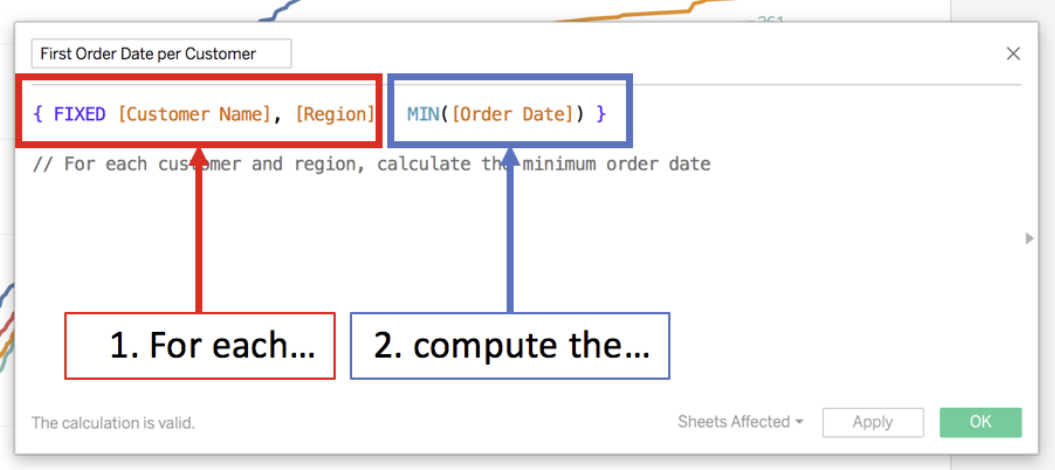
Took me a while to wrap my head around LODs, until one of our coaches compared it to the Summarize tool in Alteryx. For those that haven’t used Alteryx and don’t understand the analogy, level of detail calculations allow the user to control their data's granularity. A more human explanation of LODs is the following:

For each dimension in the red rectangle you calculate the value in the blue rectangle. Here are some use cases for LOD calculations I've found most useful so far:
Segmenting Data - you can summarize your data by defining the level of detail for each segment. For instance you may want to segment customer base by region and product category. In this case, you use an LOD calculation to define the level of detail for each segment as the combination of region and product category.
Find the min or max - there are times when you might want to use the minimum and maximum in a times series, such as the minim order date to establish when a customer first made a purchase:

Or you may want to find the highlight the maximum sales in a given time period:

You can also find and compare related data using parameters and LODs. Let's say you want to compare sub-category sales to best performing sub-category. You'd start by creating a parameter 'Selected Sub-category' and use this parameter in a level of detail calculation:

These are the use case I've found most useful so far and I'm sure I'll be adding to it over the next few weeks, but a more comprehensive list can be found here.
