


Our first task for dashboard week was to build an app in Alteryx using UK crime data that would allow the user to select a specific point on a map, the radius, a date range & a type of crime which would update a data source that feeds a Tableau dashboard. I broke down the project into 3 parts: the app, the data source and the dashboard.
Lessons learned throughout the day and tips for future dashboard days:
- Set time goals for each specific part of the project and scope accordingly
- Remember that you can come back to unfinished tasks later in the day
- If you have questions regarding requirements and priorities the earlier you ask the better
- To connect to Google Drive files pick Google Drive from the Server list of Tableau data sources; don't try to navigate to the file using your local directory
I started by reading the requirements then reading them again. After looking over the files I found out we have 3 types of files all with different fields and noticed only one the files might be needed.
Began working on cleaning the data and building the app in Alteryx just before 10AM. This proved a bit more challenging than I thought because we were meant to use tools I had limited experience with (map input and map interface) and because I did not keep a copy of the spatial Alteryx refresher workflow & macro we had built a week prior. With a bit of help from previous Data School blogs and coaches I managed to get the app working.
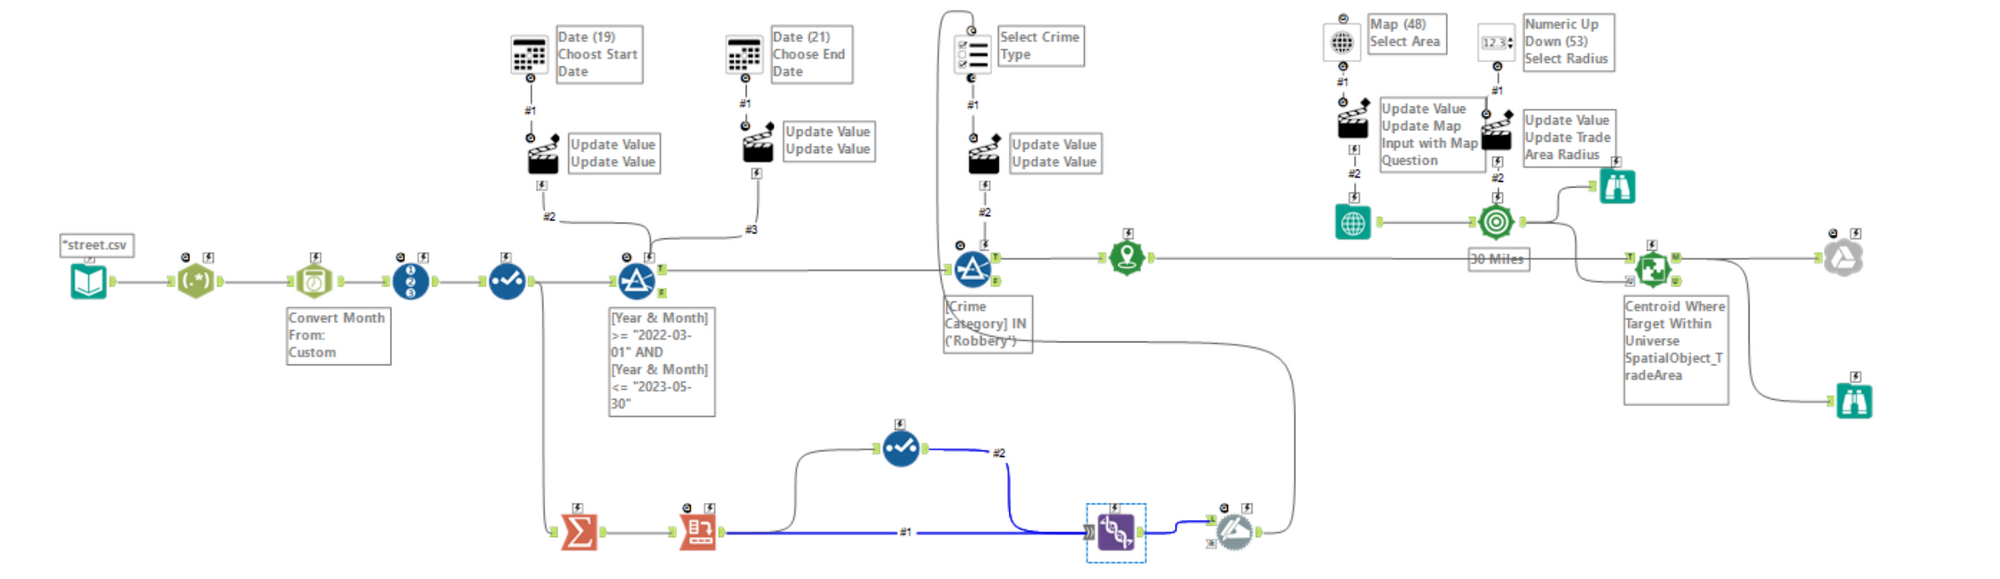
The trickiest parts was making the Map Input tool work and configure the output to Google Drive which took about one and a half hour, but I also got a bit stuck when trying to make the crime selection option as a multiple list where the user could select multiple crime categories. I got this sorted right after lunch and decided to skip the sketch and focus on making the dashboard and reflecting on the day.
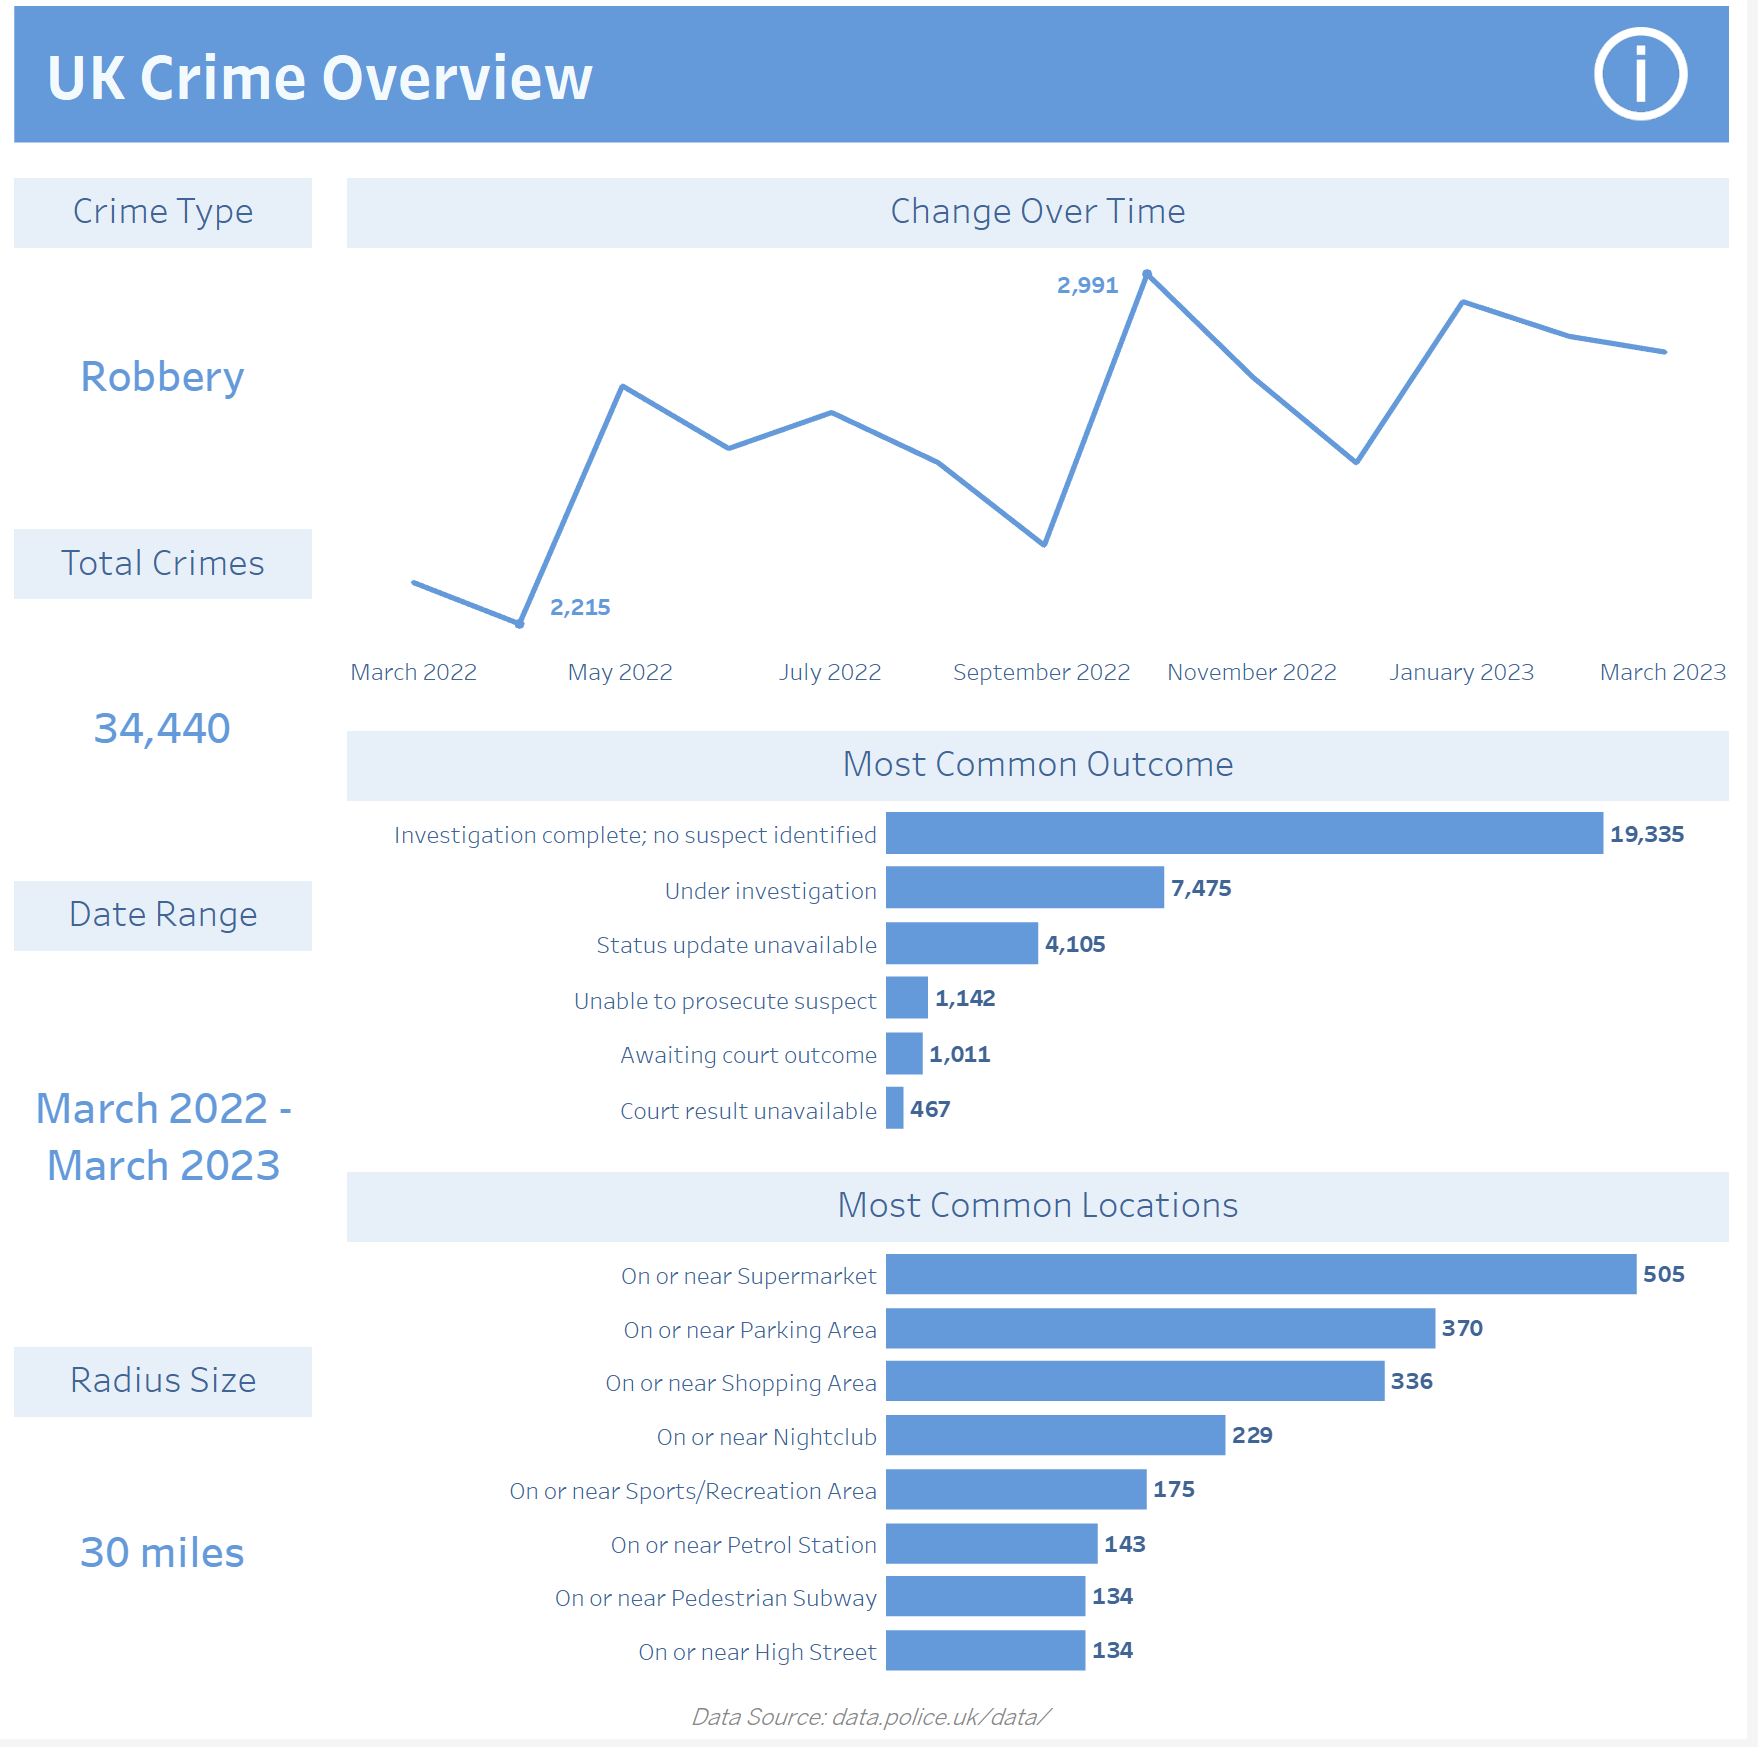
As the brief required a KPI dashboard, I kept it simple and only showed all the selections previously made within the app along with the most relevant information.
I enjoyed the challenge and I'm glad I skipped the sketching to focus on the dashboard but plan on setting time aside for this for the rest of the week!