Today our task was to create an accessibility dashboard with data related to Road Constructions in Glasgow.
Project requirements:
Glasgow City Council are trying to make their city’s data more accessible to residents and have given us a sample of road repair data from FixMyStreet to show what we can do.
Create a product which enables users who are not well served by current interfaces to access data about their surroundings. Be prepared to explain every design choice on your dashboard.
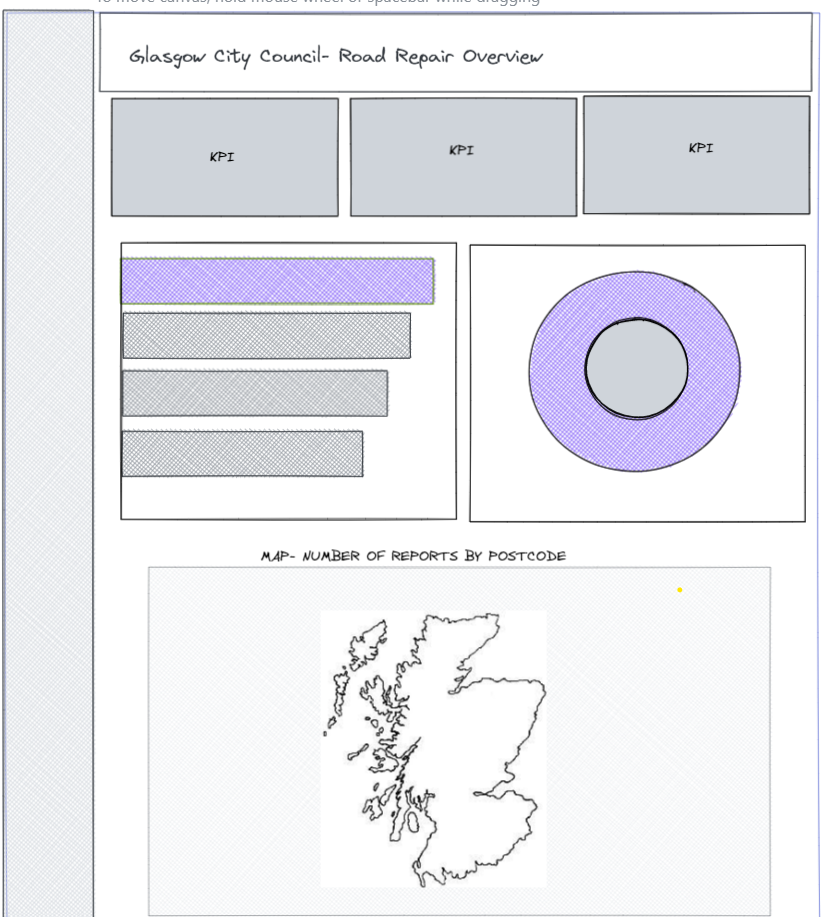
I started first by creating a user story and a drawing in Excalidraw. That helped me have an understanding on what I should do next and what types of charts I should have. This is how my initial drawing looked like in Excalidraw:
The next step was to prepare the data. Luckily, the data was decent, so I just had to separate the postcodes from the full address using RegEx.
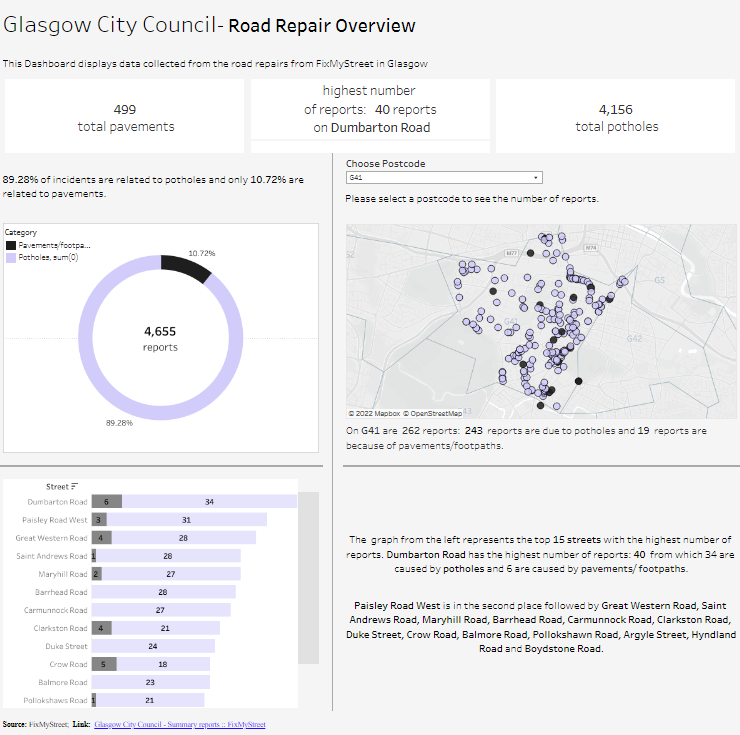
The third and final step was to upload the data in Tableau and create the charts along with the dashboard. This was the part that took a lot of time because I had to emphasize with the topic and find the best graphs suggestions for people who are using screen readers or have any type of accessibility issue.
I had included some titles with KPIs that could be read using Narrator along with some graphs with captions. Because the Narrator cannot read anything in the chart area (including tables), I included more details in the captions. I also made sure that my format is above size 12 so that it can be easy to read.
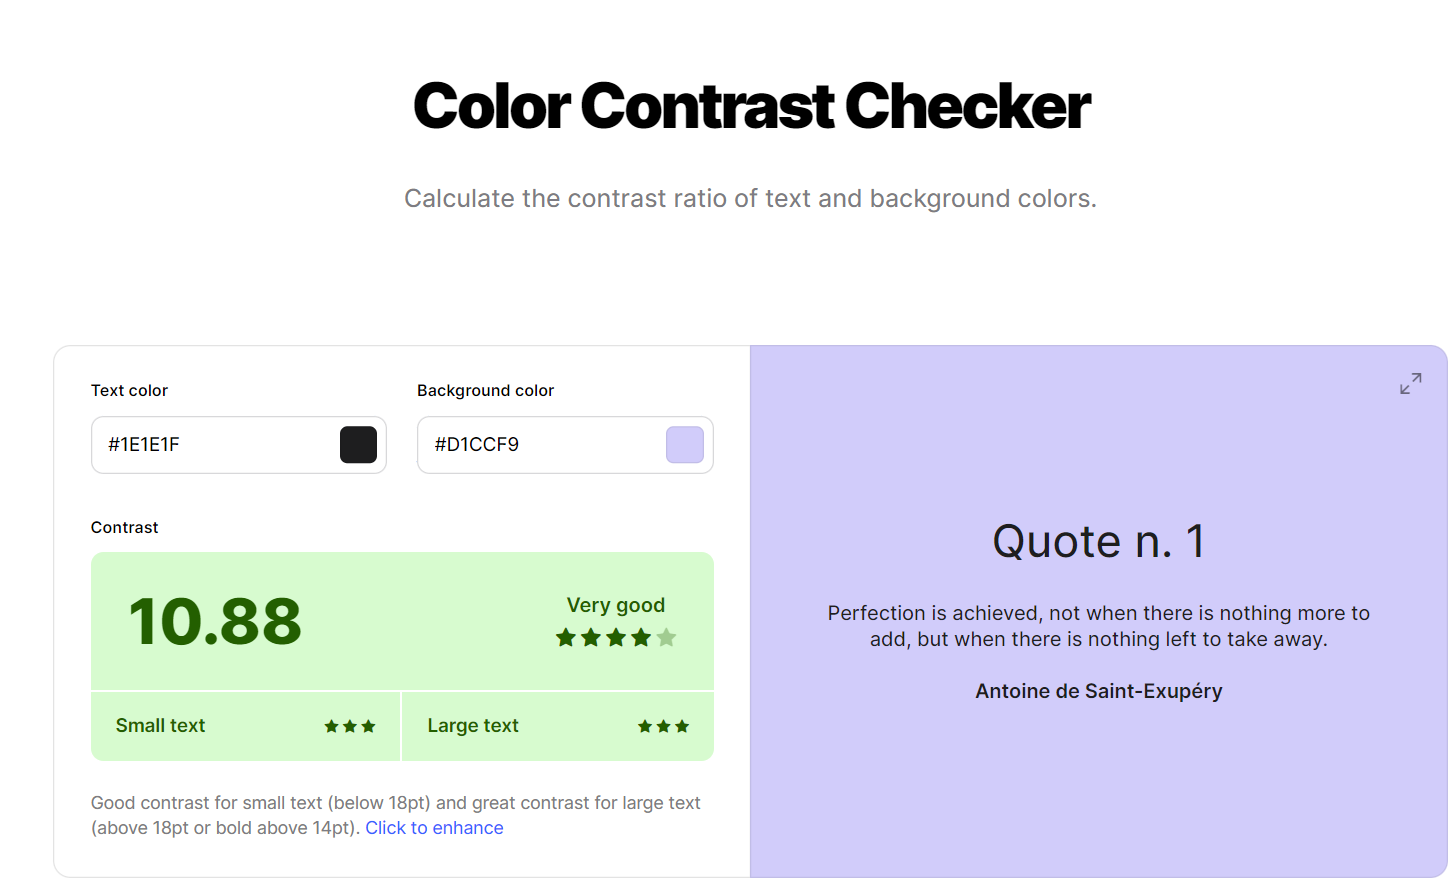
Final step was to choose the colors for the graphs. For this, I went to Color Contrast Checker on https://coolors.co/contrast-checker to verify if the colors that I want to use are suitable for people with accessibility issues.
My final dashboard can be viewed in here or on tableau public using this link.