


Day 4 of Dashboard Week involved APIs and AI!
Goal: build an Alteryx App that builds a HTML trend analysis report based on the user input.
- Decide whether to use the Historical Weather API or the Wikimedia API and design an Alteryx App that allows for user inputs:
- A location (if using the Weather API)
- A Wikipedia page (if using the Wikipedia API)
- A time range (start and end date)
- Optional inputs that allow the user to change the prompts/output formats to the desired standard
The Alteryx App will need to pull in the data for that timeframe, create an LLM prompt using the AI Prompt Tool and request a trend report in HTML format so it can be rendered directly in our browsers upon completion.
The trend report must:
- Be engaging and clean
- Give the user a fun/adventurous template as an optional output
Prompt optimisation is encouraged, as a non-optimised prompt example will show a poor optimised output!
Hints:
- Make sure you are signed into the Alteryx One app before opening Designer
- The prompt tool should show you have access to Google Gemini, and three models of V2.5
- Start with the basic one and limit the maximum tokens before expanding it
- AI Prompt Tool sends one AI prompt per row of data going in, hence be sure to feed the whole dataset into the prompt tool at once.
- AI likes structured data like JSON, Comma Separated Data, Markdown, etc.
I chose to do the Historical Weather API.
API Documentation:
How do you ask for data?
To get weather data, build a web link (URL) by telling Open-Meteo where, when, and what you want to look up.
To get any answer, you must supply these 4 details:
- Latitude
- Longitude
- start_date
- end_date
Optional details:
- Elevation
- Hourly/daily
- temperature_unit, etc.
Choosing what data you want:
You can ask for hour-by-hour updates (hourly) or whole-day summaries (daily):
- Hourly metrics
- temperature_2m (air temp)
- relative_humidity_2m
- rain, etc.
- Daily metrics
- temperature_2m_max, etc.
I chose to look at daily metrics.

Pricing and usage rules:
- Can make up to 10,000 requests per day for free without an API key
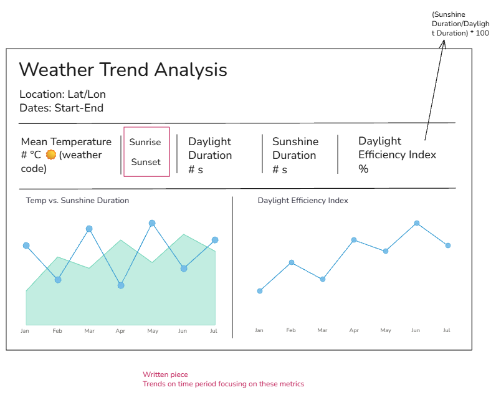
Report Sketch
API in Alteryx
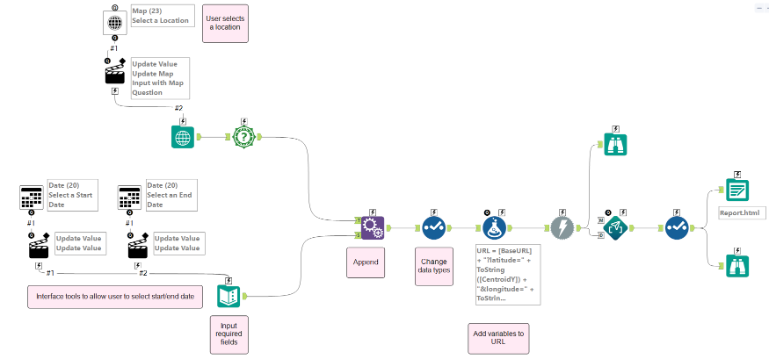
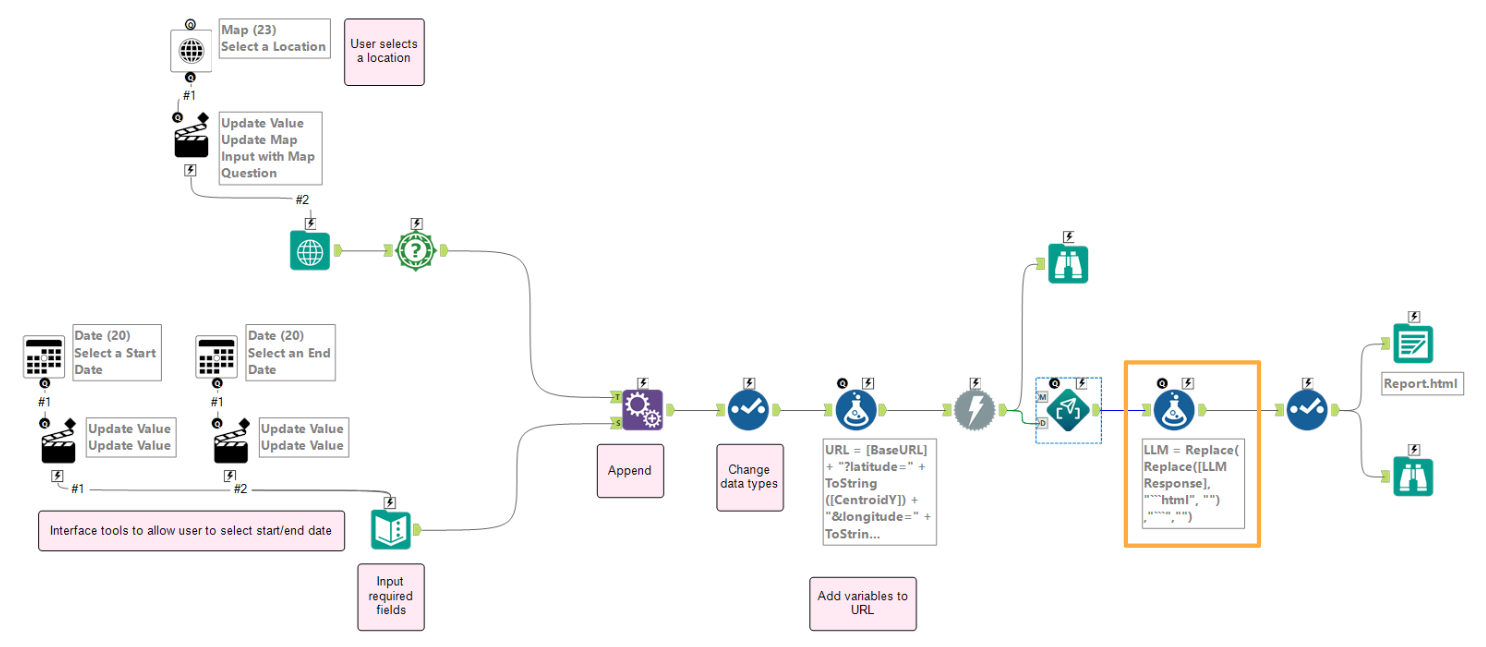
This workflow was used to make the an app in Alteryx to allow the user to select a location and time frame which would then update the API.
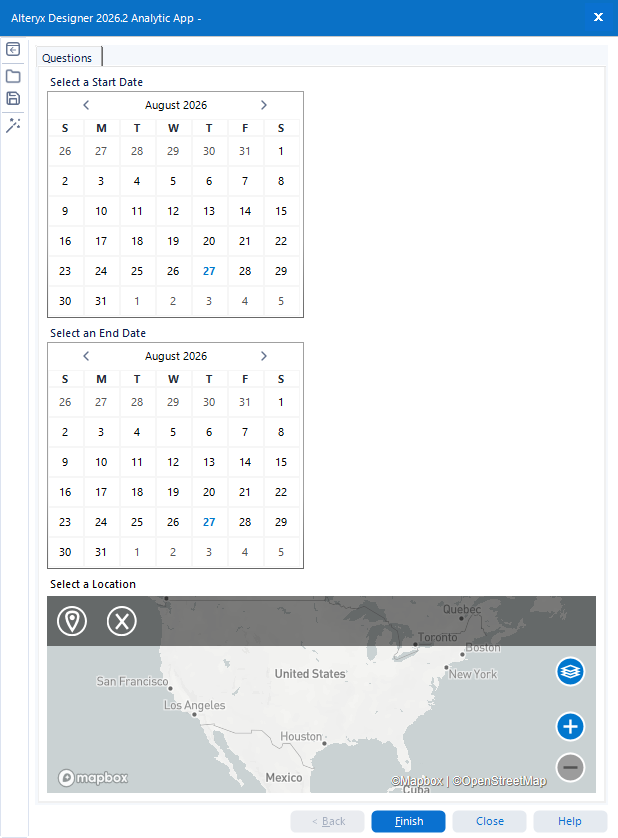
Once I had configured the app and ensured that the API connection worked, I used the Prompt tool in Alteryx to create a report based on the user's selection of time and location.
Prompt
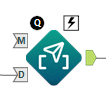
It takes information from a spreadsheet (like numbers or locations) and slots it directly into a pre-written text template. This creates custom instructions to hand off to an AI, saving the user from writing out prompts manually for every row of data.
After asking Gemini how to prompt the Prompt Tool in Alteryx, I configured the tool and got my first report!
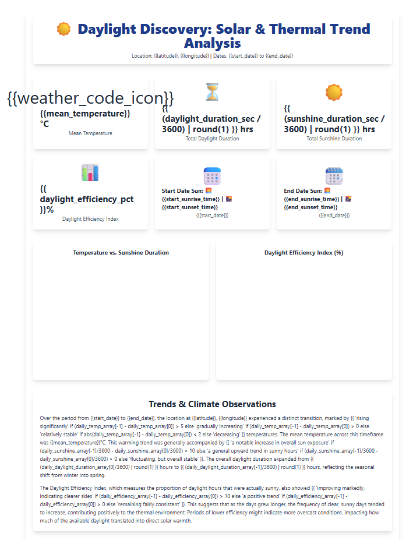
The report was structured how I wanted, but it was not pulling in the data from the API, so fields like 'Mean Temperature' were showing up as {{mean temperature}}, not the actual value.
So, I decided to reevaluate the prompt I fed into the Prompt Tool. After a few adjustments, the report looked like this:
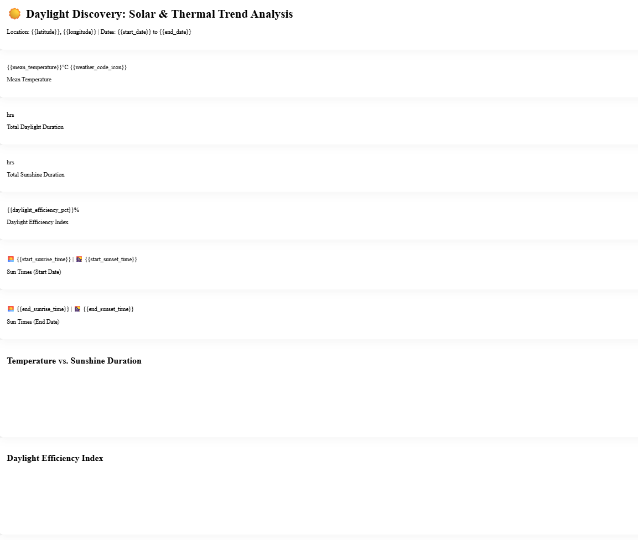
Again, the fields were not changing based on user selection, they were merely displaying the field names. After changing the prompt again, I generated the following report:

The third report was completely blank!
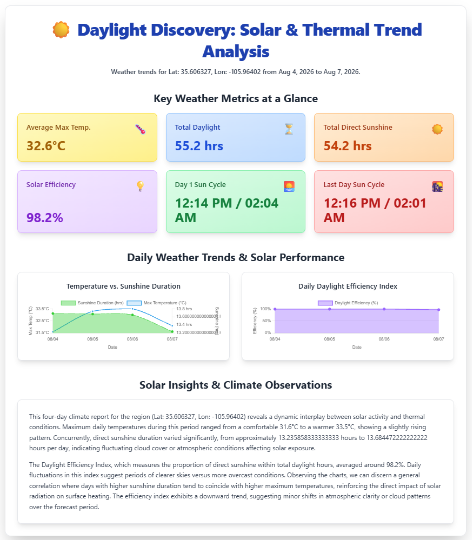
After adding another Formula Tool and specifying to the Prompt tool that it had to use the [DownloadData] as the data source, the report finally worked!
☀️ Daylight Discovery: Solar & Thermal Trend Analysis
Weather trends for Lat: 35.606327, Lon: -105.96402 from Aug 4, 2026 to Aug 7, 2026.
Key Weather Metrics at a Glance
Average Max Temp. 🌡️
32.6°C
Total Daylight ⏳
55.2 hrs
Total Direct Sunshine ☀️
54.2 hrs
Solar Efficiency 💡
98.2%
Day 1 Sun Cycle 🌅
12:14 PM / 02:04 AM
Last Day Sun Cycle 🌇
12:16 PM / 02:01 AM
Daily Weather Trends & Solar Performance
Temperature vs. Sunshine Duration
Daily Daylight Efficiency Index
Solar Insights & Climate Observations
This four-day climate report for the region (Lat: 35.606327, Lon: -105.96402) reveals a dynamic interplay between solar activity and thermal conditions. Maximum daily temperatures during this period ranged from a comfortable 31.6°C to a warmer 33.5°C, showing a slightly rising pattern. Concurrently, direct sunshine duration varied significantly, from approximately 13.235858333333333 hours to 13.684472222222222 hours per day, indicating fluctuating cloud cover or atmospheric conditions affecting solar exposure.
The Daylight Efficiency Index, which measures the proportion of direct sunshine within total daylight hours, averaged around 98.2%. Daily fluctuations in this index suggest periods of clearer skies versus more overcast conditions. Observing the charts, we can discern a general correlation where days with higher sunshine duration tend to coincide with higher maximum temperatures, reinforcing the direct impact of solar radiation on surface heating. The efficiency index exhibits a downward trend, suggesting minor shifts in atmospheric clarity or cloud patterns over the forecast period.
That's it for Day 4!