#How to - Dummy Highlight

You may have noticed when you make a graph and select something, your selection is highlighted:

This graph changes the baseline for each sub-category selected and calculates the difference in sales from the selected category. 

In this case, this is not a useful function. To eliminate this problem, you can create a 'dummy highlight'.

Step-by-step:

  1. Create a calculated field and just write a random word that is not related to your data:
The word can be anything you want! Just put it in quotation marks or apostrophe's. 

2.  left-click and drag this calculated field into your details on the marks card.
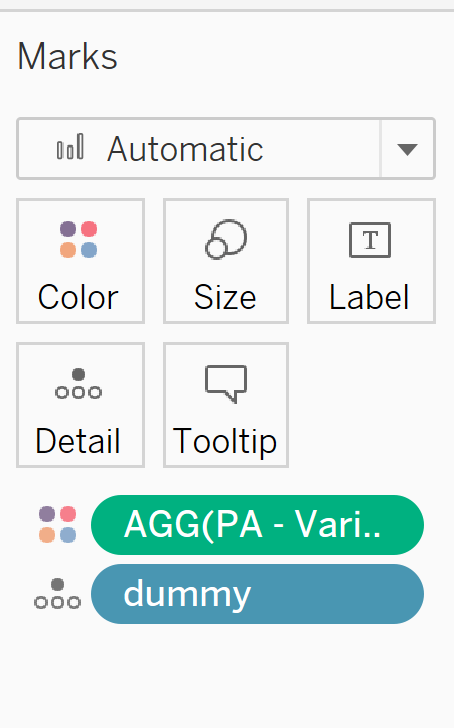
This allows it to be in the view so you can set up a highlight action. 

3. Create a highlight action and configure as follows:

Now when you click on your graph, you shouldn't see any highlights!

Author:
Amelia Holland
Powered by The Information Lab
1st Floor, 25 Watling Street, London, EC4M 9BR
Subscribe
to our Newsletter
Get the lastest news about The Data School and application tips
Subscribe now
© 2025 The Information Lab