


Todays task was to create a Eurovision Dashboard on Power BI and all data prep had to be done in Power Query.
PLAN
As a lover of Eurovision, I was very excited by this project. I started by thinking about what questions I wanted answered and came up with three ideas:
- What is the UK Journey? Who is/isn't voting for us and why?
- Song choice - do certain song charcateristics mean you are more likely to win?
- How do politics influence the scoreboard?
In the end, I decided to focus on the UK. We have a long history of scoring quite badly (except 2022) and wanted to look into why this may be.
As I am relatively new at using Power Query and Power BI, I wanted to narrow my scope so I was dealing with less data. My aim was to focus on three main metrics - Our rank and who is voting for us, our 'Nil Points' and song choices.
EXECUTION
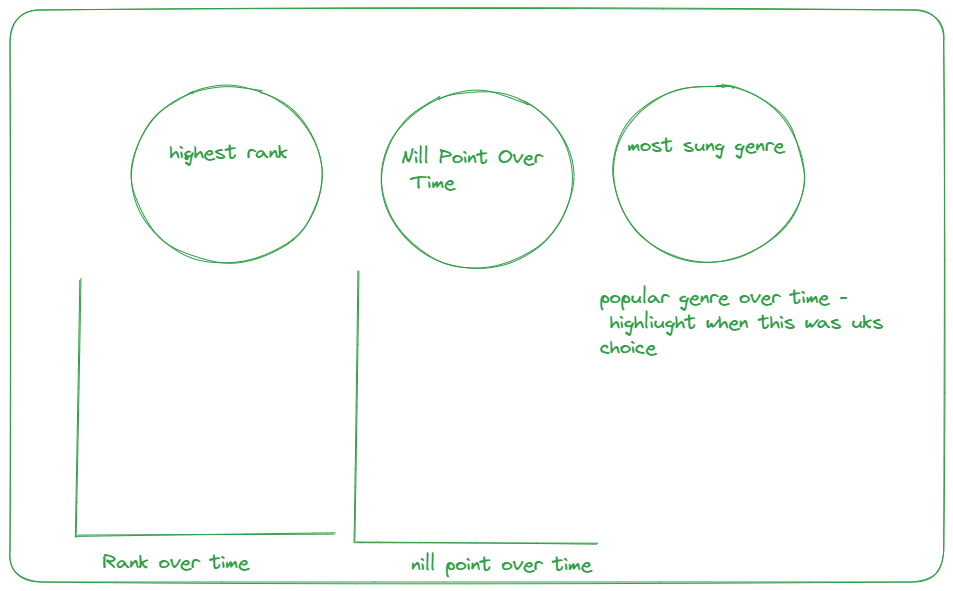
Using Power Query started off fairly difficult. I had to try and figure out how to make a rank column, which took a lot longer than expected. My ideas changed a few times as I was exploring the data, which meant that my final dashboard was far removed from my original design. I ended up going for a timeline approach but unfortunately ran out of time.
This is where I got up to:
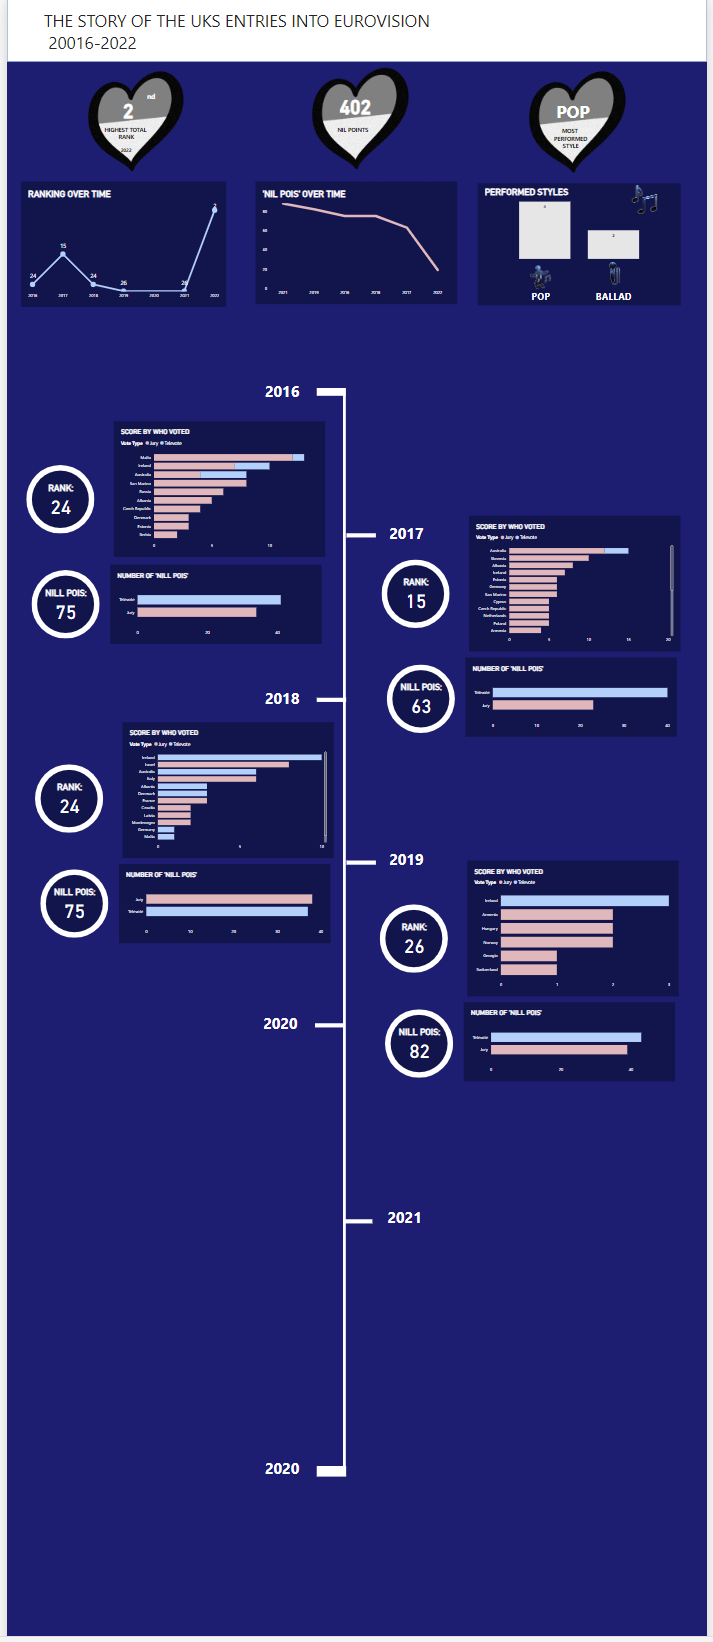
COMPLETED
Check out the completed viz below 👇

