Today's challenge was to retrieve data from the balldontile API.
After looking at the API, I decided to narrow my scope to focus on the rival teams : the LA Lakers and the Boston Celtics.
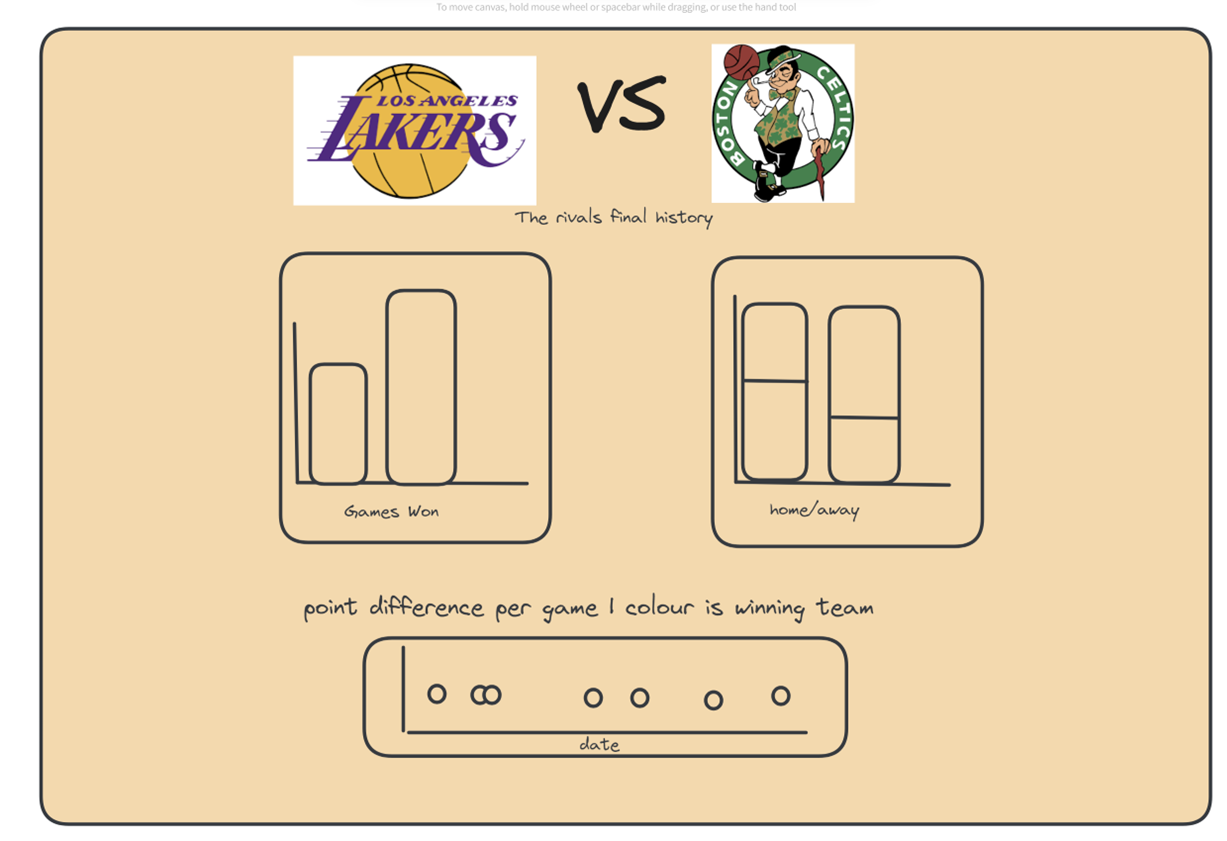
PLAN
Before downloading the data from the API, I decided to plan what I wanted my dashboard to look like, so that I could identify what fields I would need and data sets I would need to call.
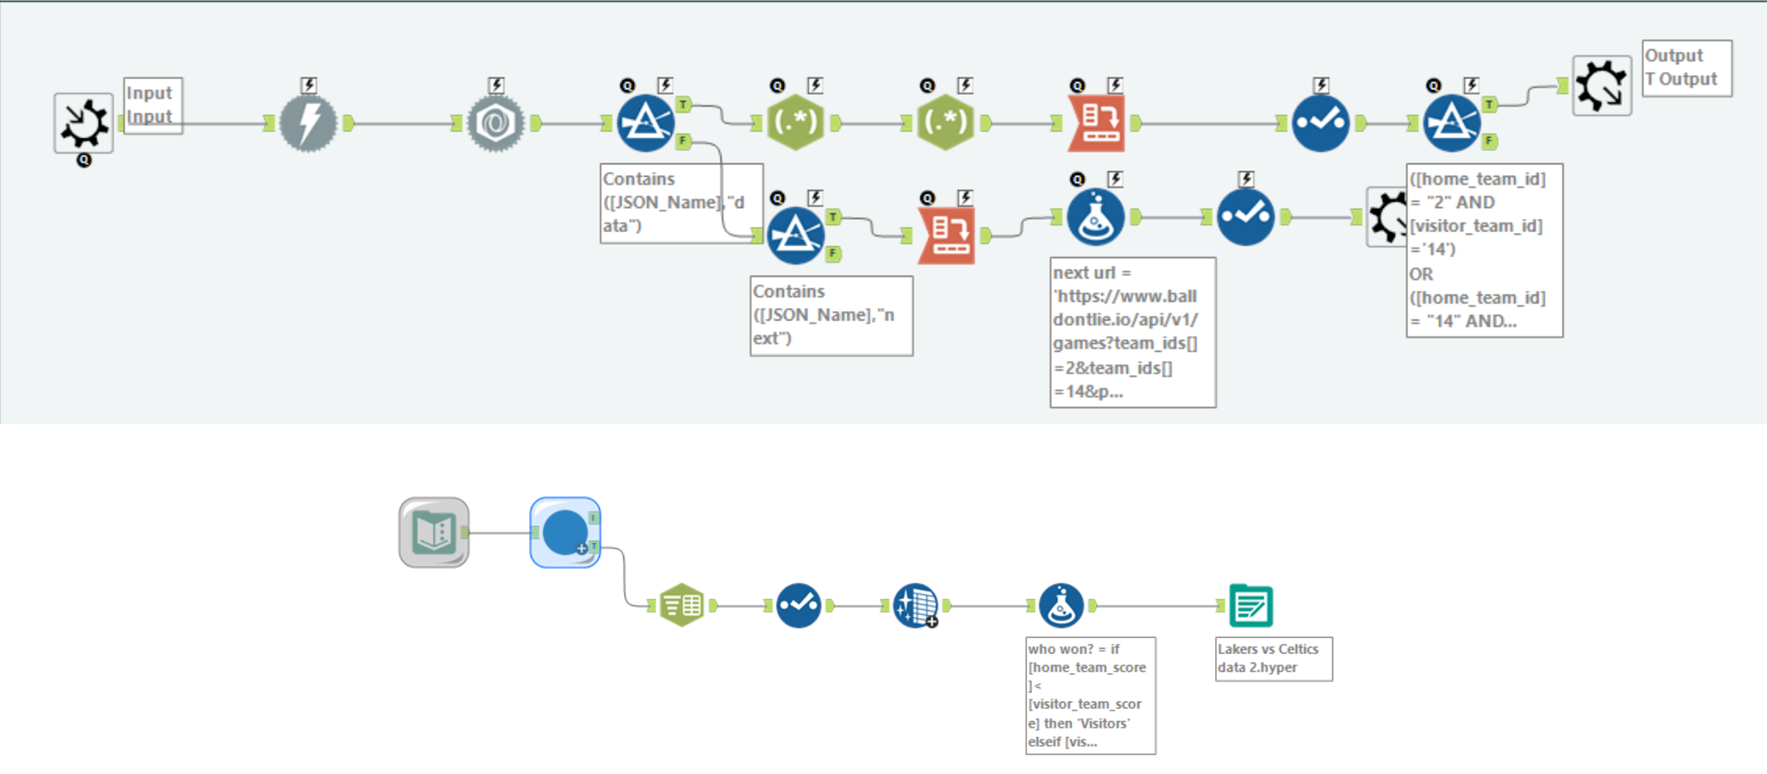
DATA PREP
I then began the process of preparing the data. Using Alteryx, I first returned a list of the teams, in order to identify the ids for the two teams I had chosen. I then created an iterative macro that called all of the game information (paginating the responses) and filtered the data to show only the Lakers vs Celtics games.
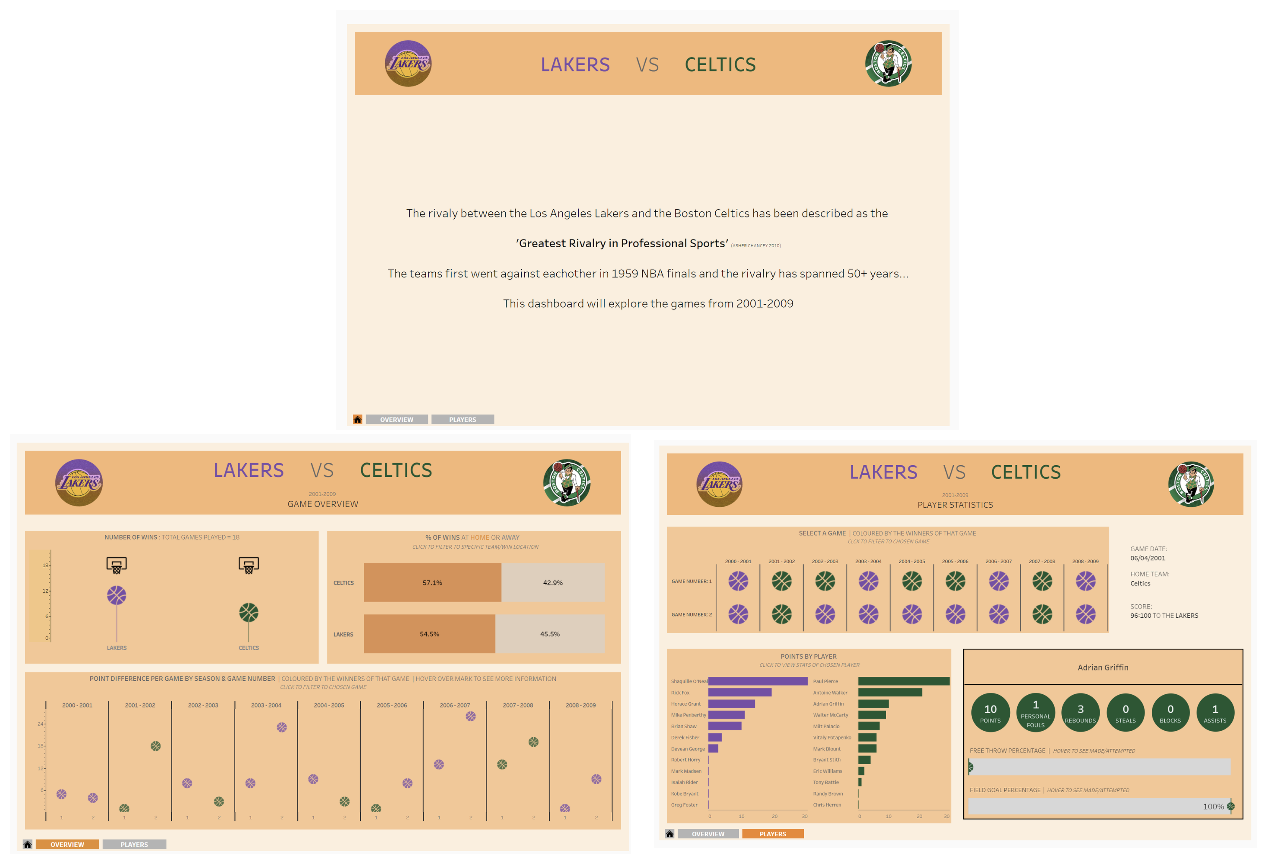
PRESENTED DASHBOARD
Carl provided some very helpful feedback as someone who is a massive fan of the NBA. It seems I misunderstood what the 'final' meant in the 'status' field, and thought it indicated that these games were NBA finals. However, this was just an indicator that the game had finished and that the score was final. I rejigged a few aspects of my dashboard to fix this mistake.
FINAL DASHBOARD
Follow the link to see the final dashboard on tableau public 👇