


Our task for this week was to makeover our application vizzes. I wanted to focus on making sure all of the charts in my viz aligned with my intended user story. I also wanted to make sure that my viz was spaced out well and easy to follow.
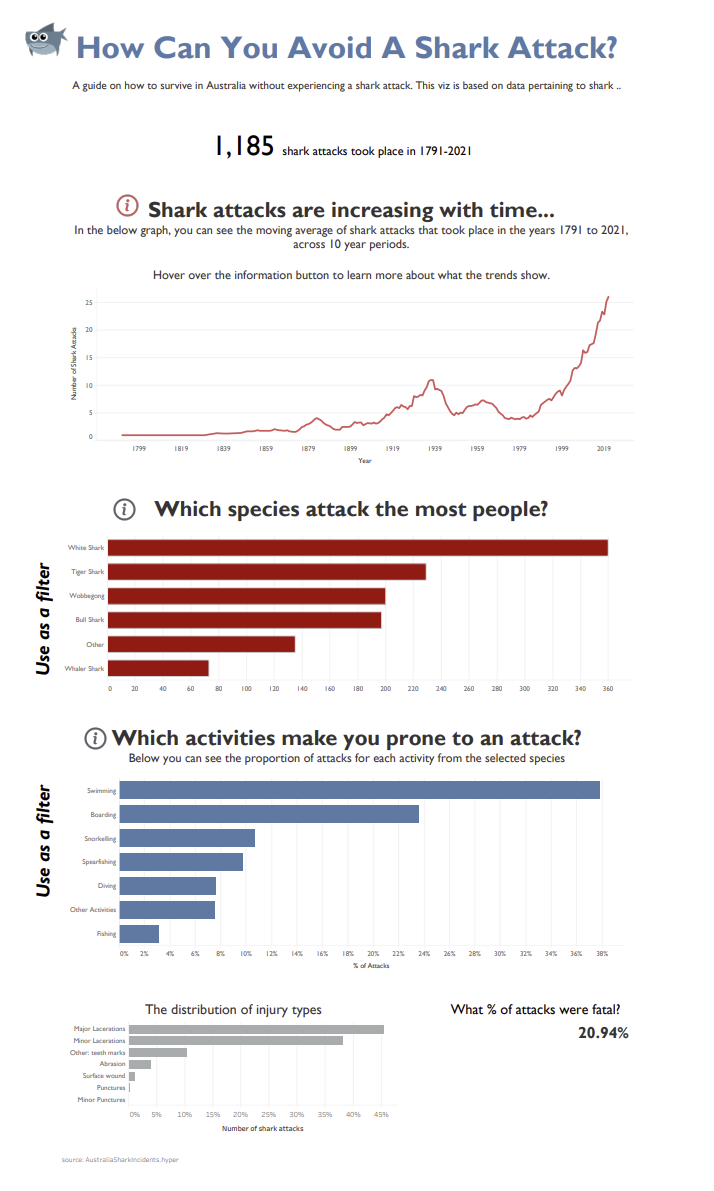
My initial viz looked like:
I made it less interactive and much more informative by replacing and editing the existing charts. The changes that I made are:
- Creating more space between my charts and titles
- Changing the layout of my KPIs
- Switching out my 'activities' section to include a bar chart
- Reordering my chart to talk about species before activities
- Adding multiple charts that can be used as filters
- Removing the final chart because it doesn't relate to my user story
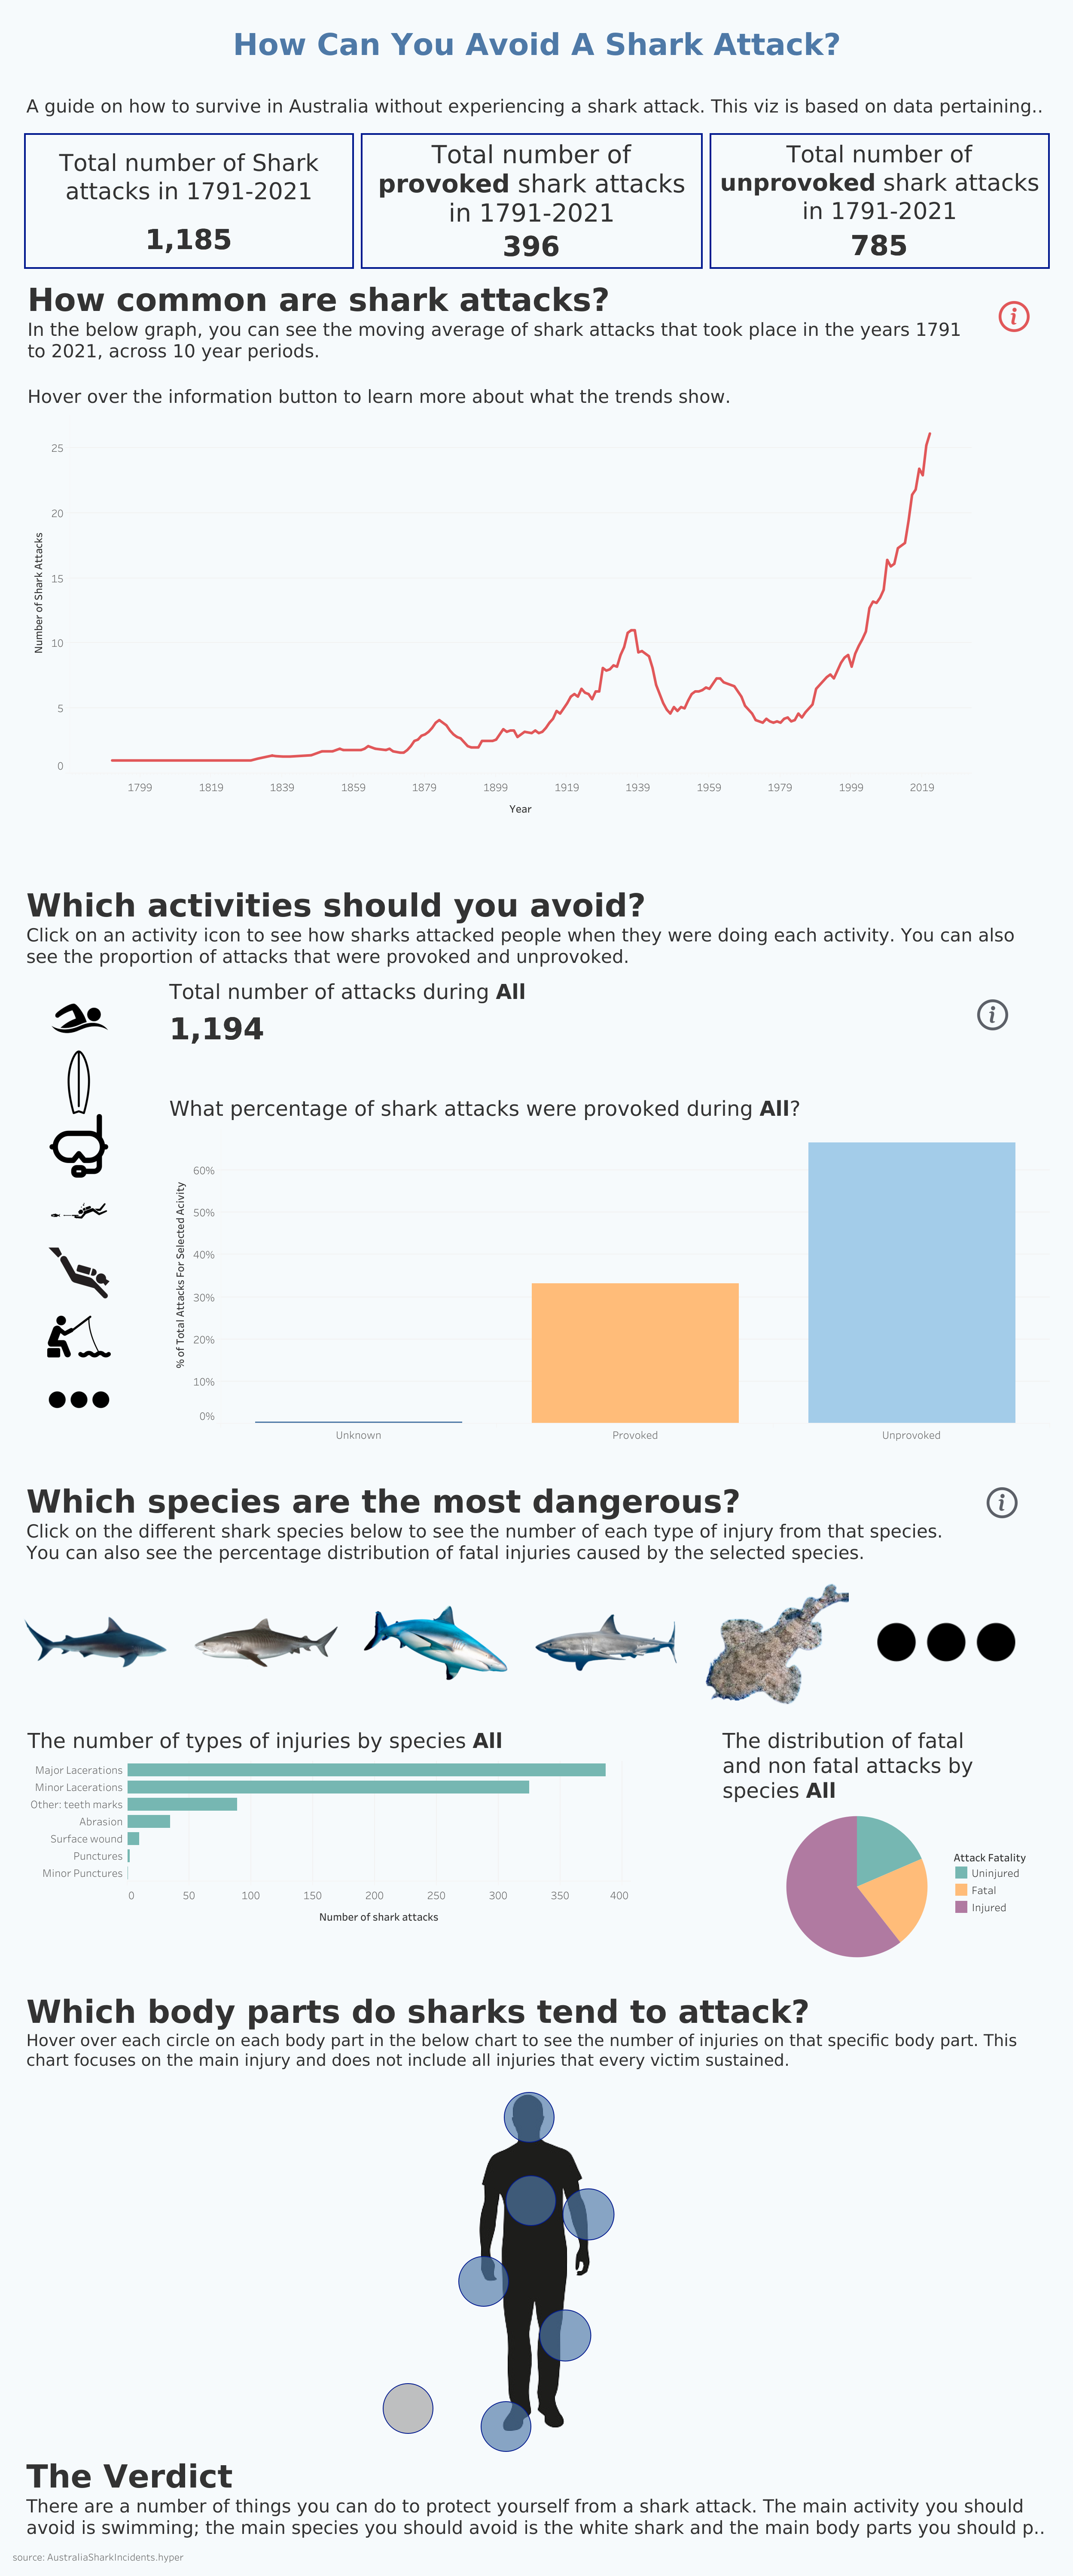
Here is my updated viz:
In my next dashboard, I need to think about making sure that my entire dashboard flows well.