


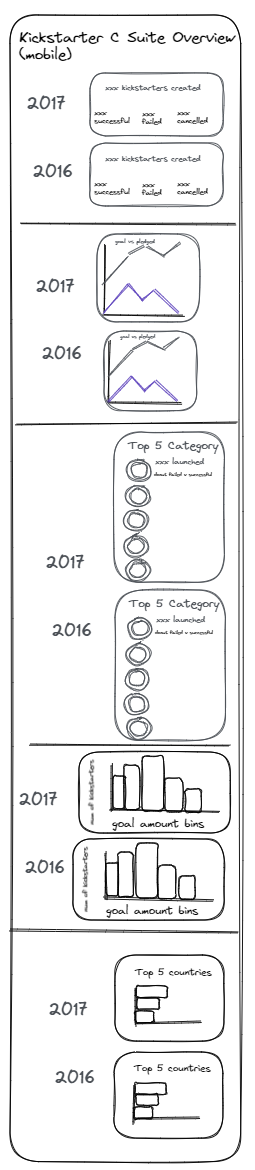
Today's project involved creating a dashboard that can adapt to desktop and mobile layouts. We were given the following dataset on Kaggle.


We were given the option to either make a C suite level or analyst level dashboard. I chose to make a C suite level dashboard.
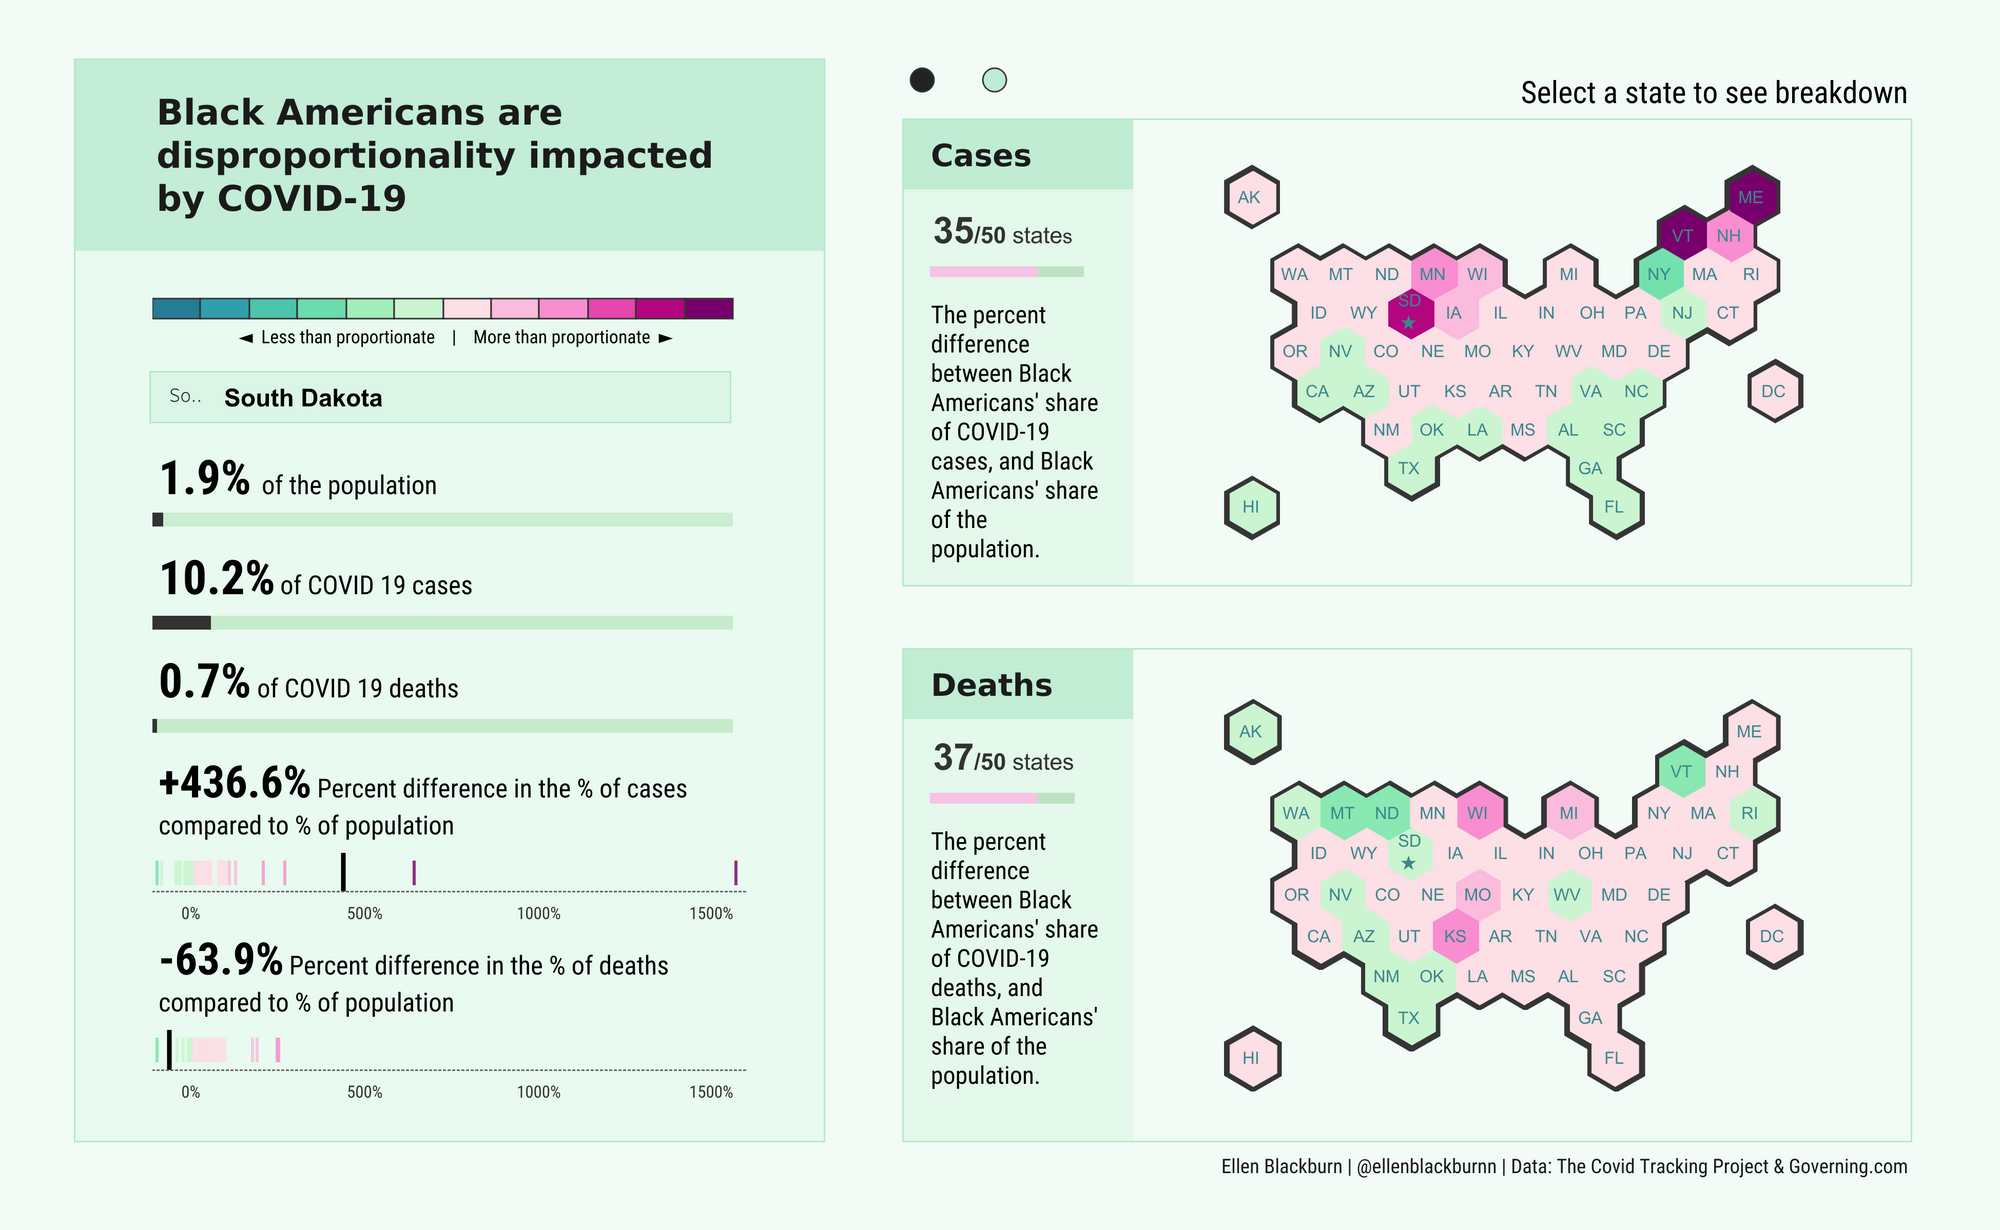
As the focus was on creating an adaptive design, I spent a significant amount of time focusing on finding design inspiration. My design was heavily inspired by the following dashboard by Ellen Blackburn:
https://public.tableau.com/app/profile/ellen4268/viz/ThedisproportionateimpactofCOVID-19/Dashboard1
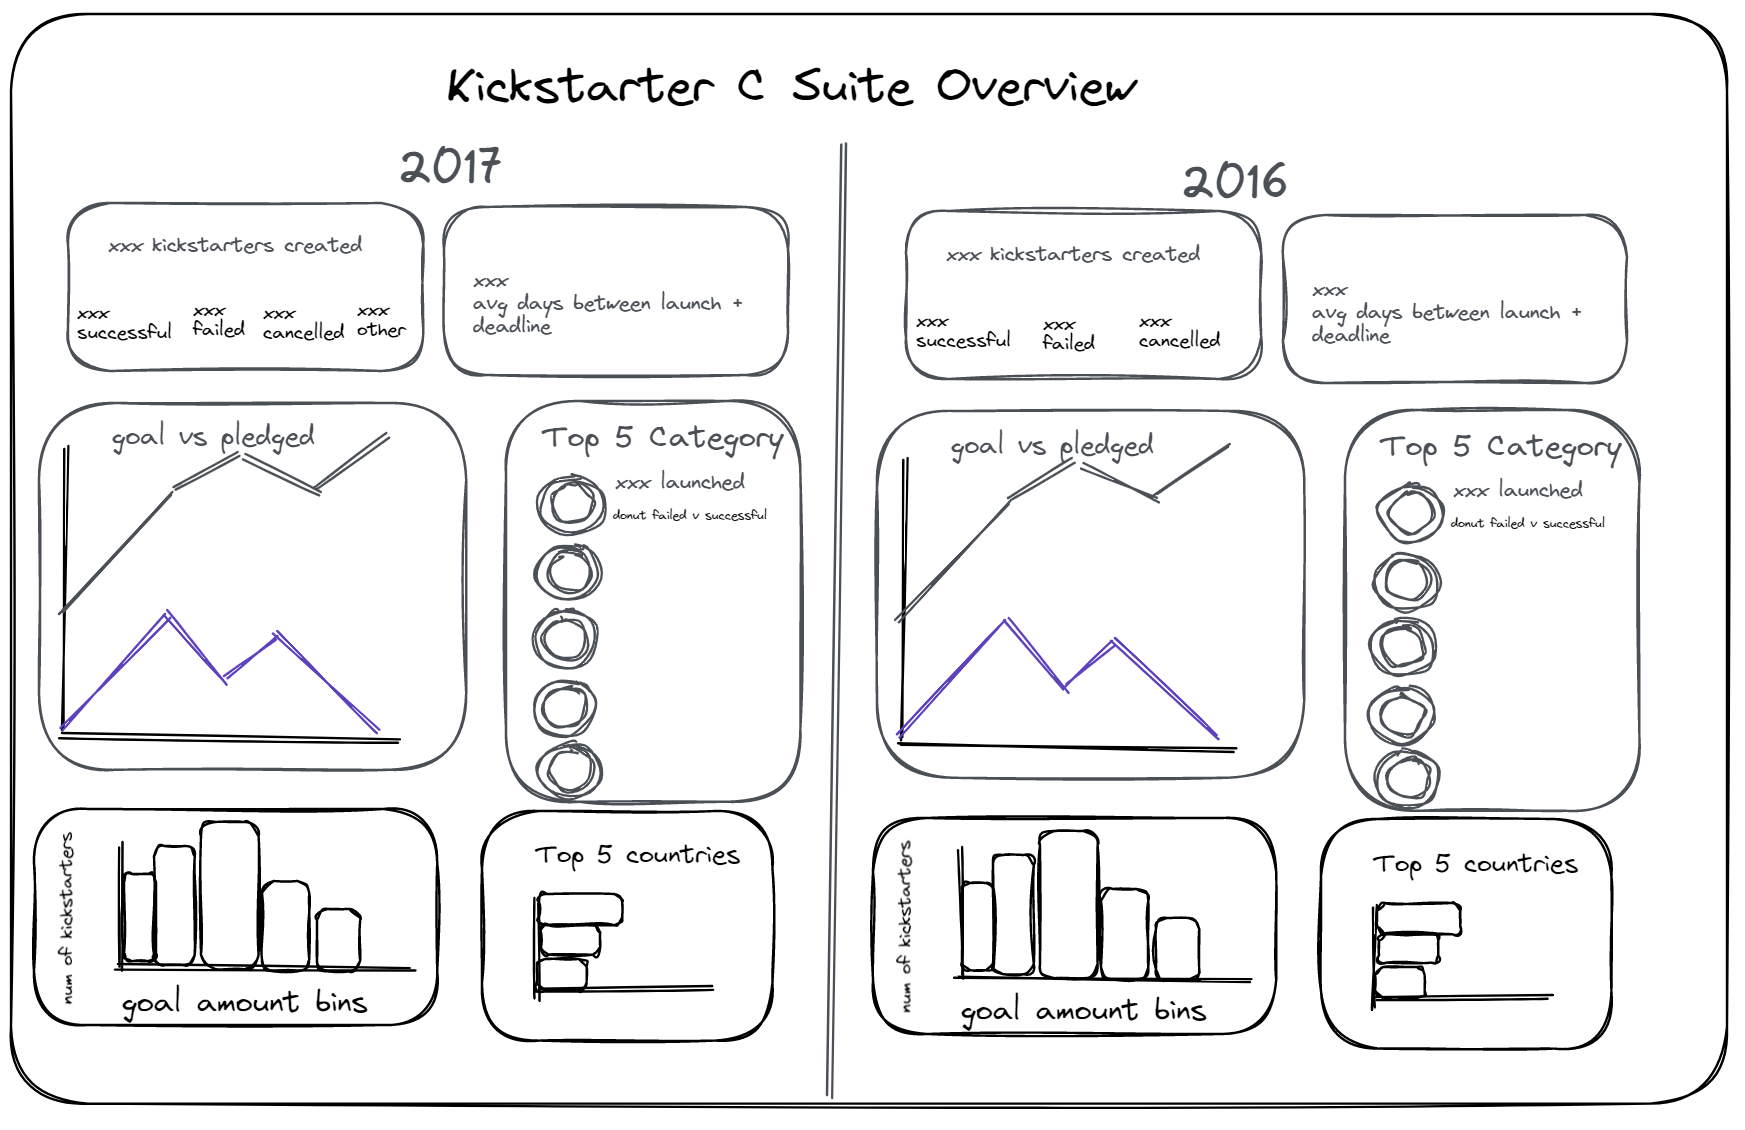
I created a dashboard with a comparison of the most recent year in the dataset and the previous year (2017 and 2016 respectively).
These are the designs that I came up with:
My final dashboard looks like this:
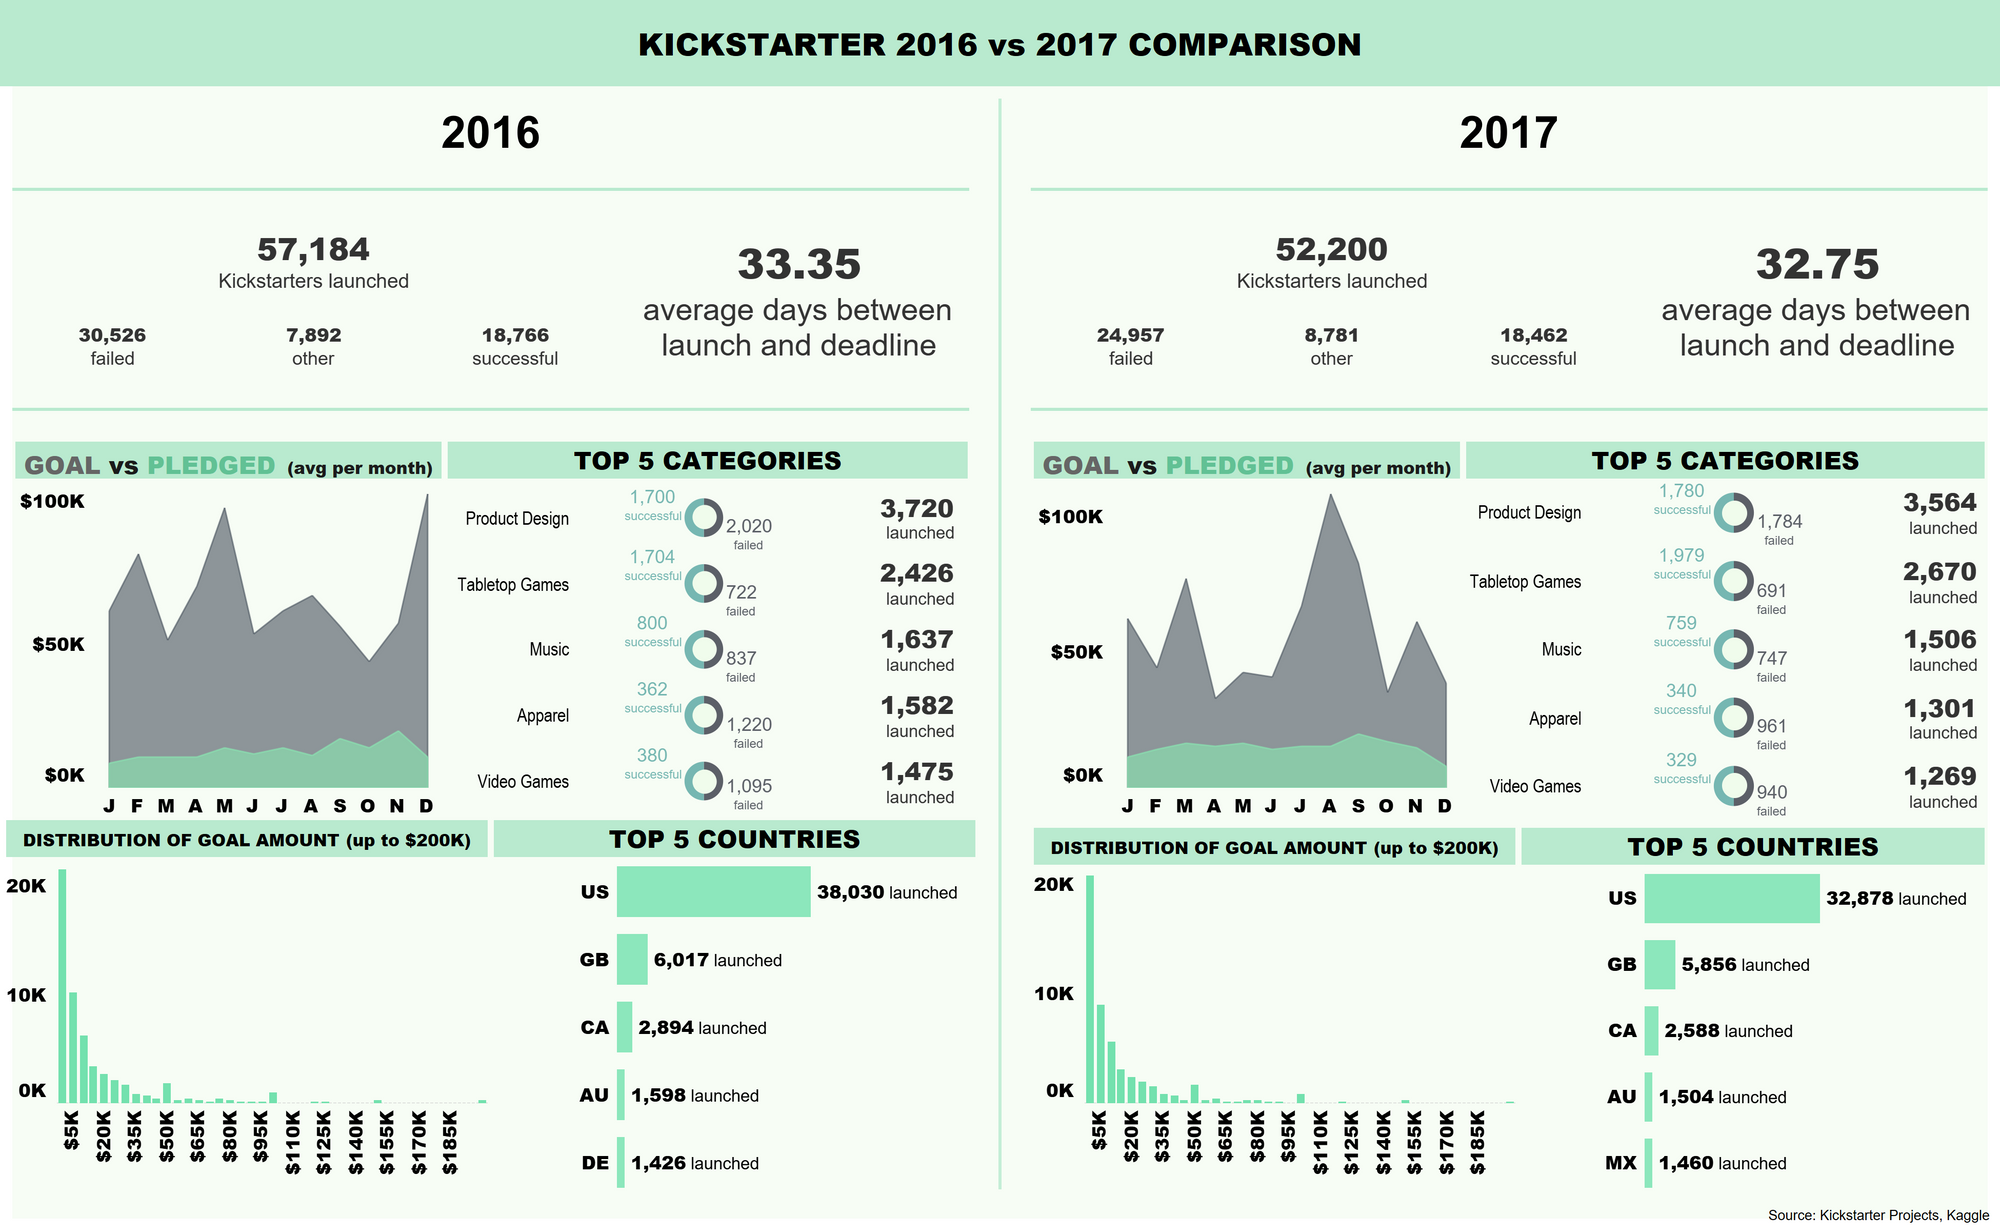
I spent a lot of time working on the design aspect of the dashboard to make it as eyecatching as possible.