


The second day of dashboard week involved a lot of data preparation and data analysis.
We were given the following dataset to work with: https://cancercontrol.cancer.gov/brp/tcrb/tus-cps/questionnaires-data
I spent a lot of time trying to find a way to open and explore the data. This is because the data came in the form of a DAT file and I had never worked with this type of data before. I then decided to push it into Alteryx to parse and select the relevant fields that I wanted to use in my final dashboard.
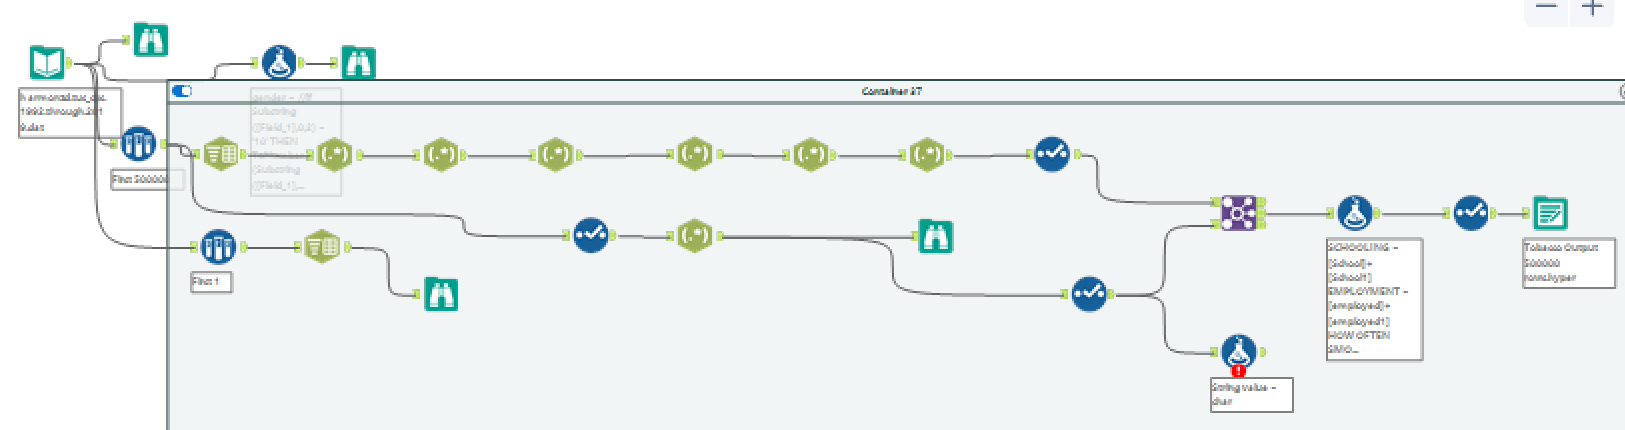
I initally used multiple RegEx parse and Text to Columns tools to create this monstrosity of a workflow:
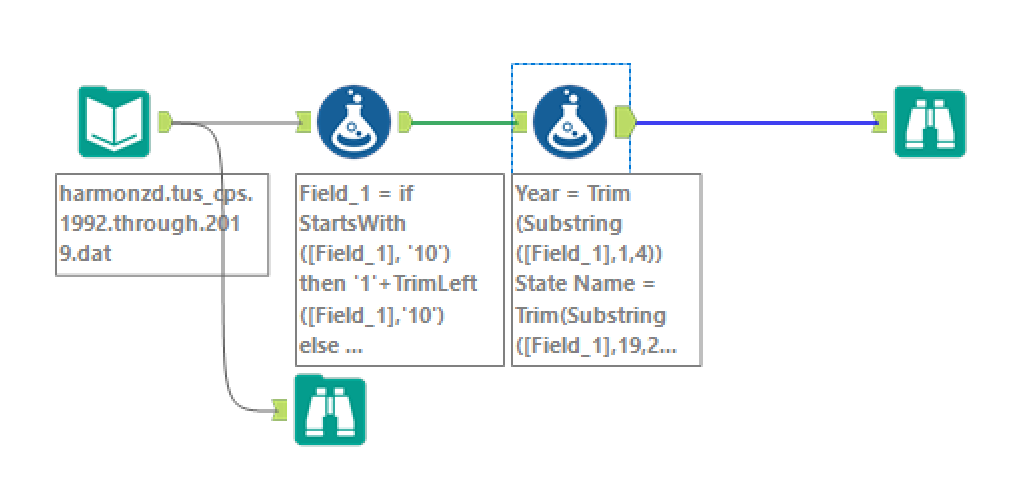
After discussing with other members of my cohort, I realised that using the substring function in the formula tool would be the best option for this type of data. I then created this workflow:
The entire process of pulling and cleaning the data took a significant amount of time.
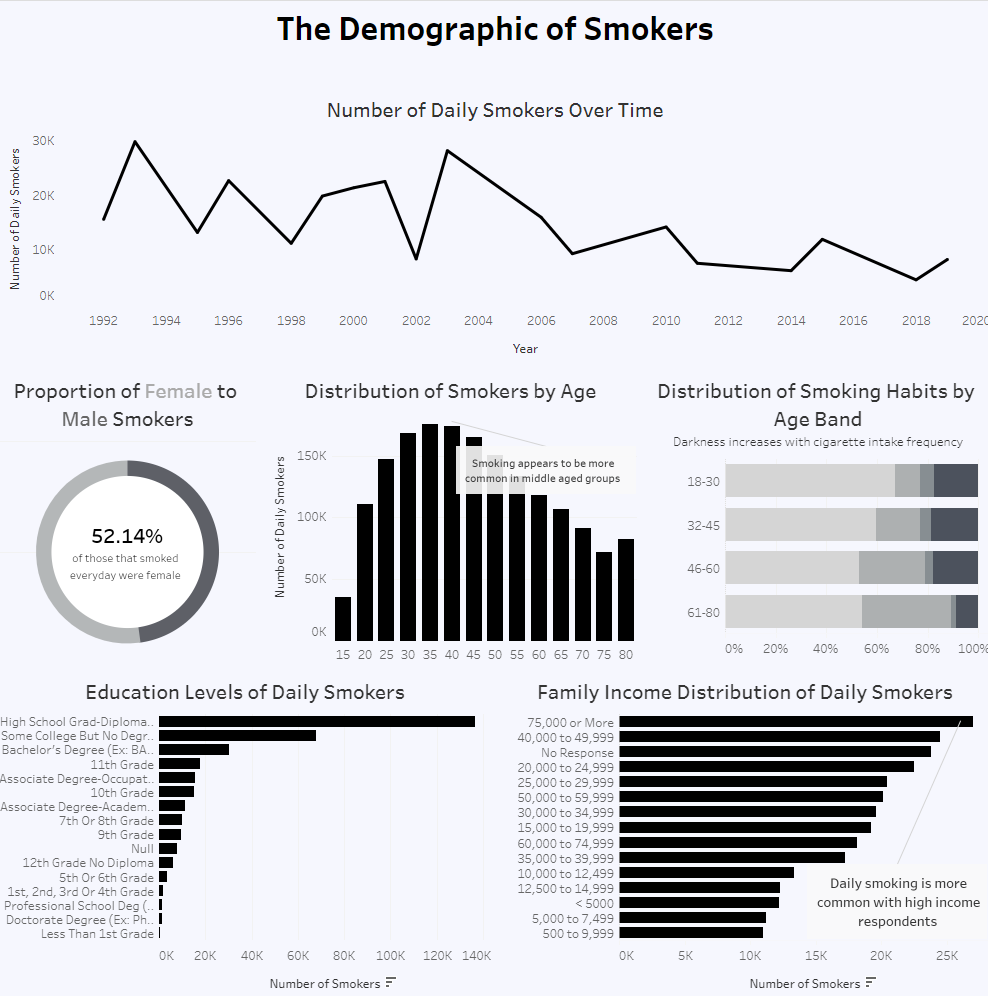
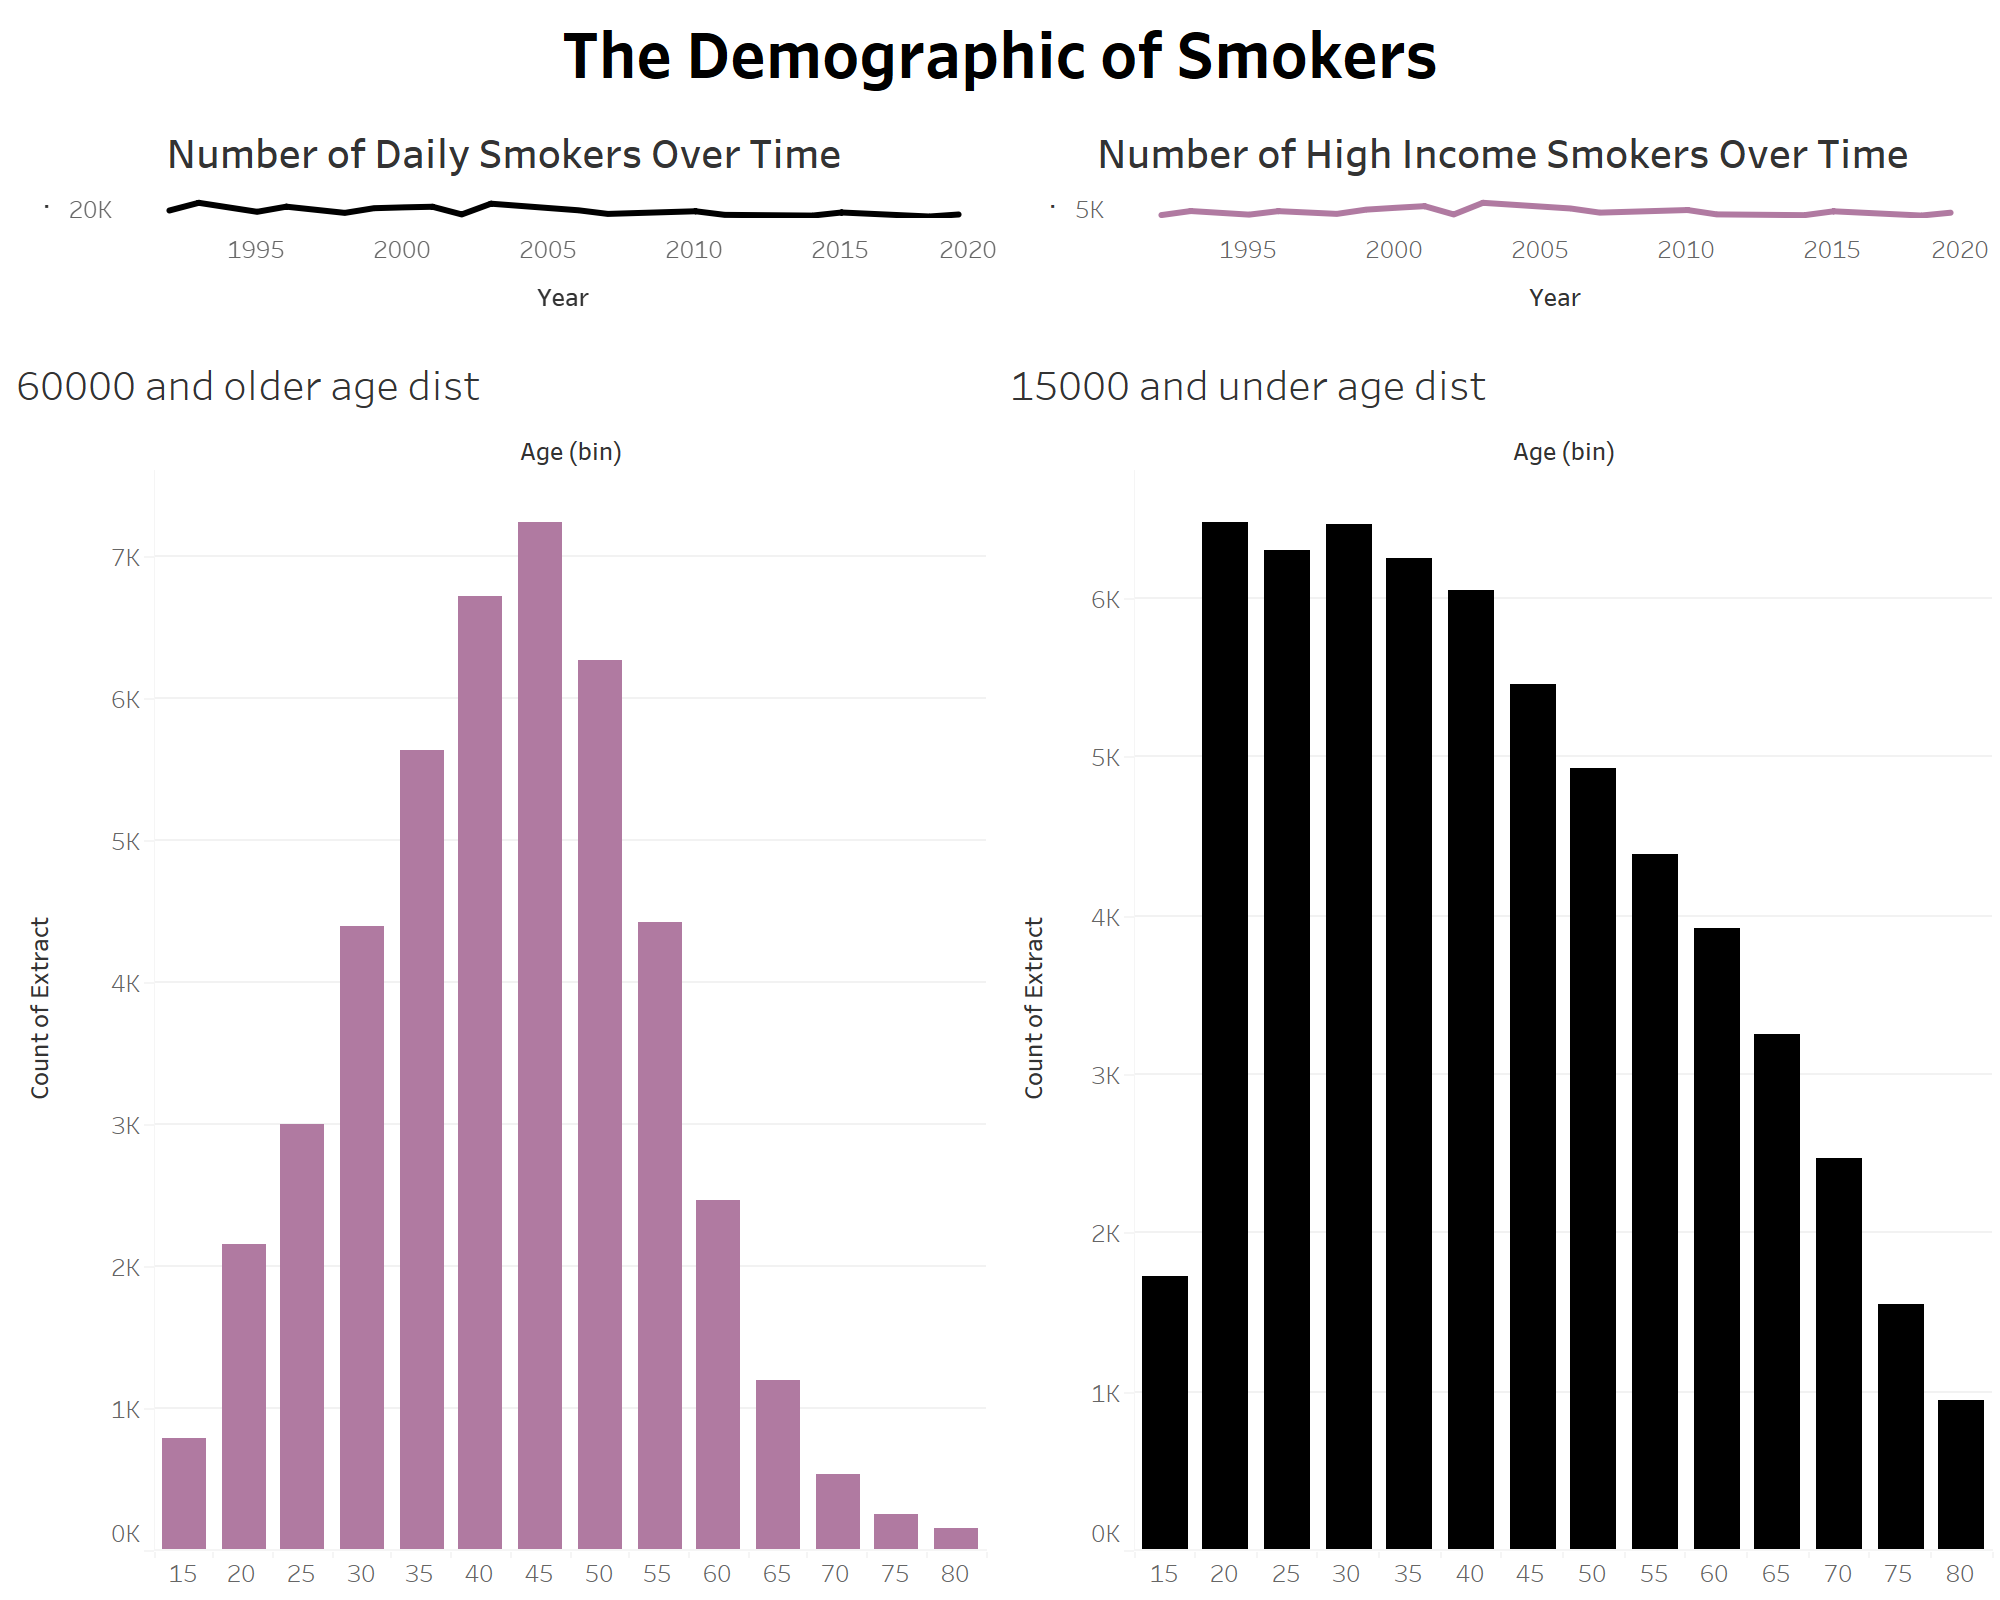
I then produced the following dashboard to represent the metrics I was able to pull:
I also spent some time exploring different trends in the data to create the following 2 (unformatted) dashboards:
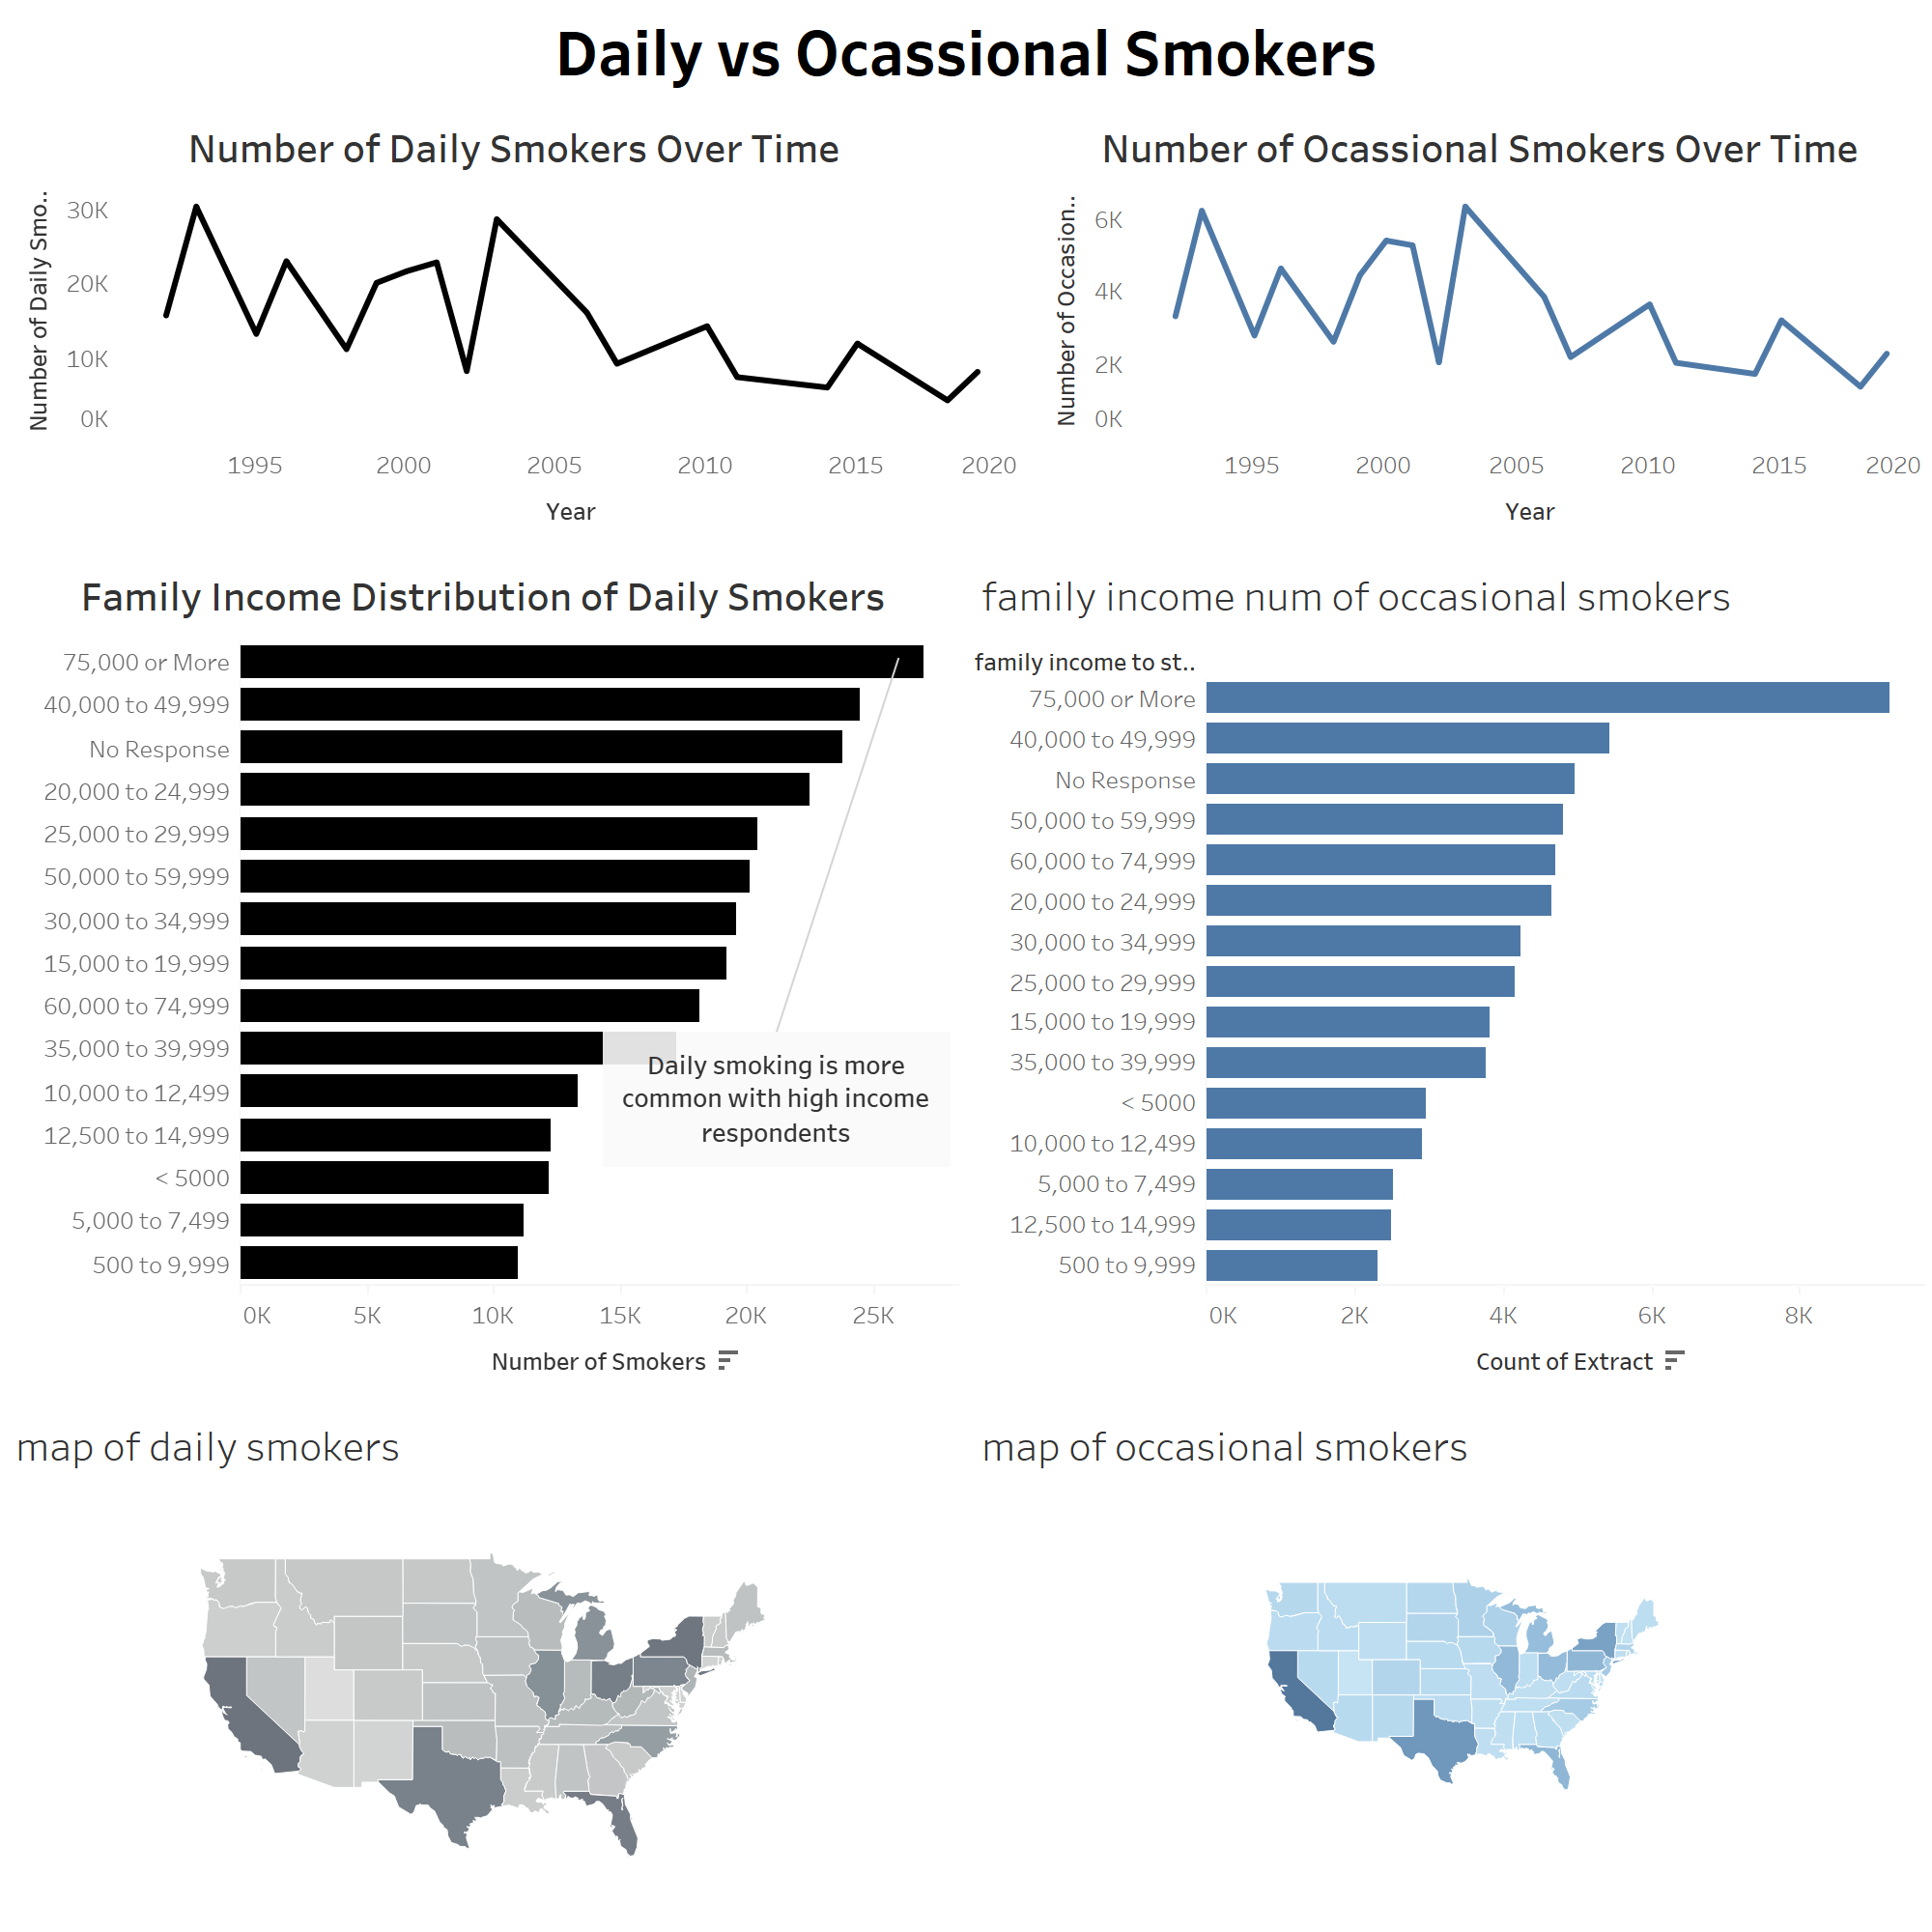
If I had more time, I would have explored my analysis more deeply and spent some time formatting my second and third dashboards.