The 8th week at the Data School was an important week. We learned a lot of new things in different subjects. We learned about spatial data in Alteryx and we also were introduced to Macros in Alteryx too. I would write many pages about what we learned this week but i will focus here on only one thing that we also learned in this week, which is Table Calculations in Tableau and show one example of the use of it.
So what is Table Calculations in Tableau?
according to the definition of Tableau, "A table calculation is a transformation you apply to the values in a visualization. Table calculations are a special type of calculated field that computes on the local data in Tableau."
table calculations are used for a variaty of uses and examples of these uses are:
- turning values into Ranking
- show differences between different fields
- calculating running totals
- calculating the percentage of total for chosen values
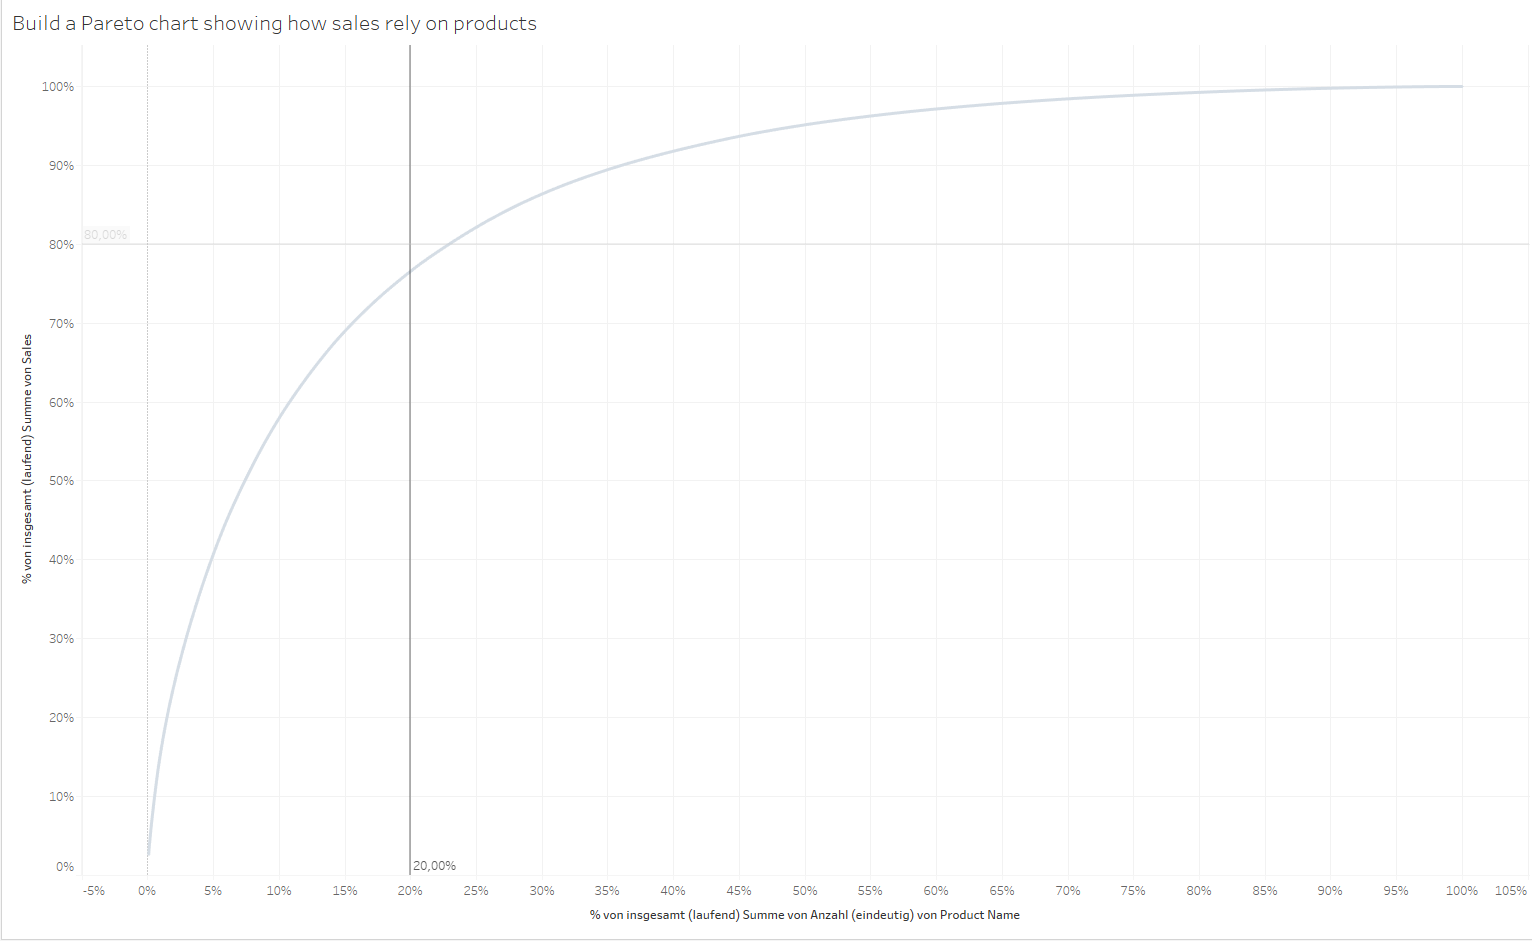
to make this brief, I am going to explain here how to create a Pareto Chart in which table calculations are used.
A Pareto Chart is a graph that shows ( in Sales for example) how many products (or percentage of products) make a specific percentage of Sales. Did you understand? lets build a chart together:
Note: to create this chart, you would need to choose Superstore Data from Tableau.
- Creat a new sheet in Tableau using the Superstore and put Product Name(CountD) on Columns and Sales on rows.
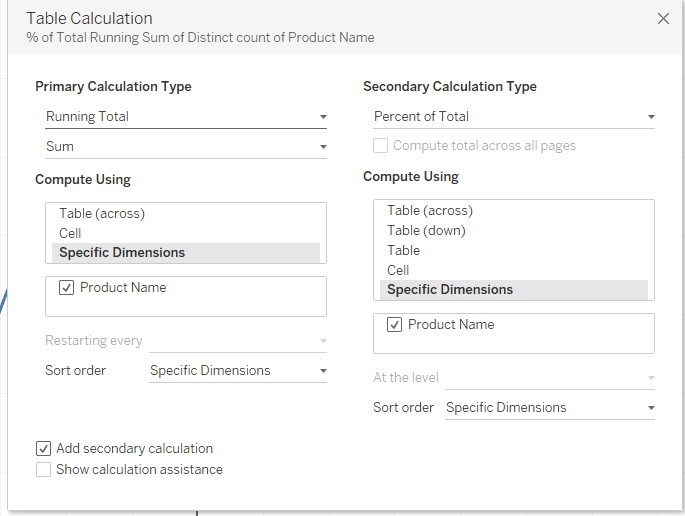
- Right click on product name and select add table Calculation and do the following ( see screenshot).
- now right click on sales and repeat the above steps.
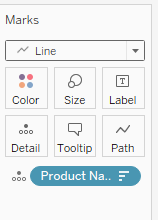
- in the marks card, put Product name on details and choose line for chart type.
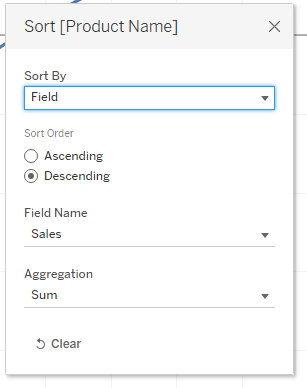
- Right click on Product Name and select Sort
- Sort by field > descending > Sales > Sum
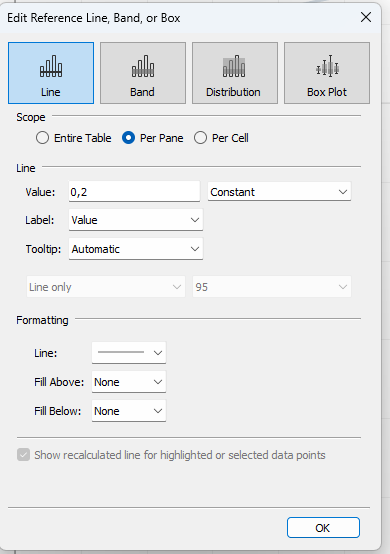
- Add a reference line to each axis and specify the percentage required.
Now you should be looking at a Pareto Chart! Enjoy formatting it :)
Try to change chart Type to are, what will it change?