Here we come to the last week of the Data School training journey. It is the dashboard week.
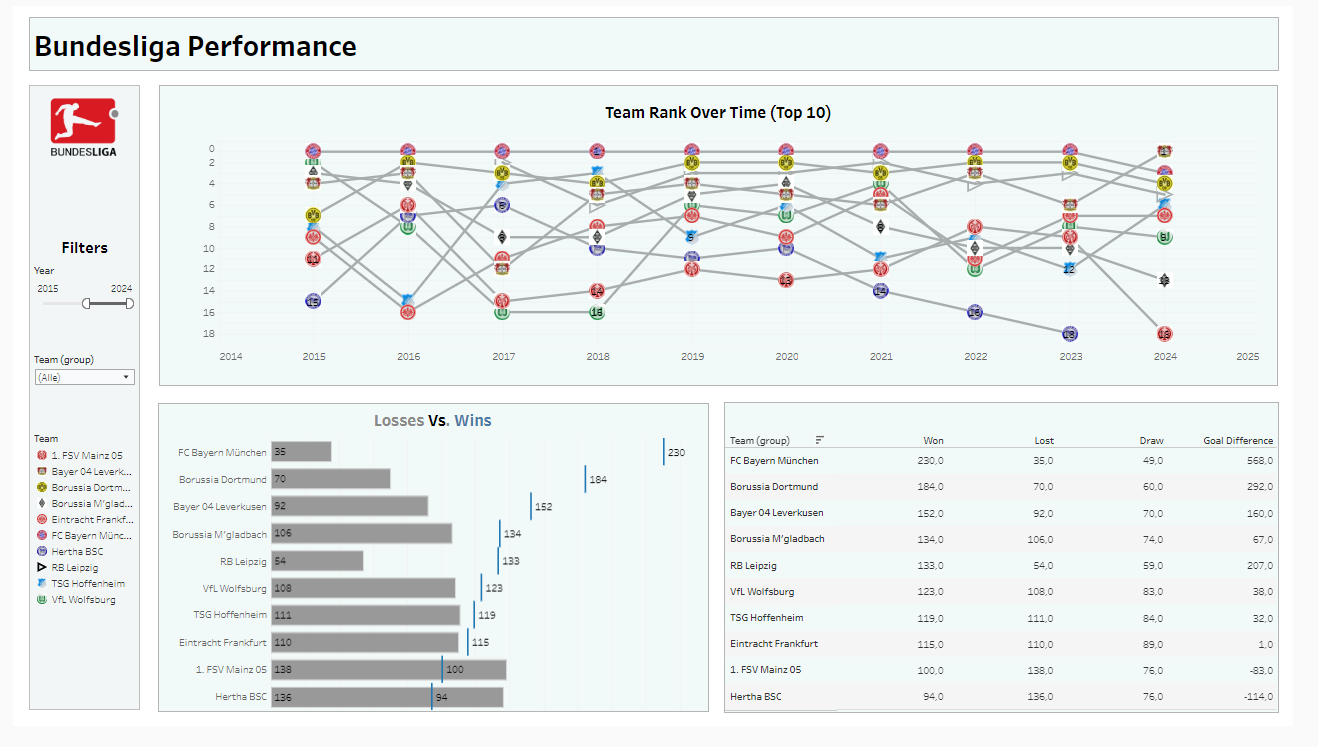
In this week, we receive a task every day, and we are supposed to create a dashboard and present it in the afternoon. So, on the first day, we were given a web scraping task. I was asked to scrape the Bundesliga website and gather data for at least the last 20 seasons to create a dashboard that shows the soccer teams' performance.
We were free to choose how to scrape the website. I started with Alteryx but, having worked with Alteryx a lot in the previous weeks, I thought about trying something else. So, I decided to use Power BI (Power Query) to scrape the data. It was almost my first time doing this, but it wasn't that challenging. I had to learn about new features in Power BI, like setting a parameter that enables me to scrape multiple pages at the same time and also setting a timeout limit for applying changes in Power BI. I couldn't do everything the way I wanted due to time constraints, but in the end, I got the data I needed to build the required dashboard.
Another challenge I faced is that I'm not a very strong football fan. So, I was pondering on how to visualize the data in a compelling way. My initial thought was to use a bump chart and a table, but I still looked in Tableau Public for inspiration. In the end, I completed the dashboard within the time frame, and I would consider it to be a successful first day.