


Week two kicked off and excitement from week one stayed there, every day is a new challenge and a new puzzle that gets to be solved. With breaks in between, we got to understand what are the best visual practices and how to apply them to our data sets. Building upon the fundamentals of what to do and not to do, and how to relay the vast knowledge of a big data set in a clear way to everyone who is not familiar with the set.
During this week we have learned a lot of different charts and how to build them, majority of them were exciting and some of them became my favourites, therefore I would like to share a couple of them with you ,reader, as it may be a chart with which you may fall in love also.
The first chart type: Donut Chart
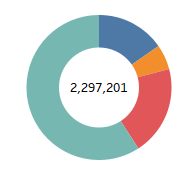
These charts are basically the better version of a pie chart, as they utilize space around them more efficiently. As an example one can use the empty space in the middle to relay information such as a % difference (if two values are compared) or total sales value (of all the parts of donut) in order to show to what it adds up and give a rough idea to the reader. They also follow a nice circular motion allowing the reader to essentially see a story of categorical change.
The second chart type: Bar in Bar chart
These charts are very useful at comparing two different dimensions such as current and previous year sales, and provide quick reference to how the two years performed against each other.
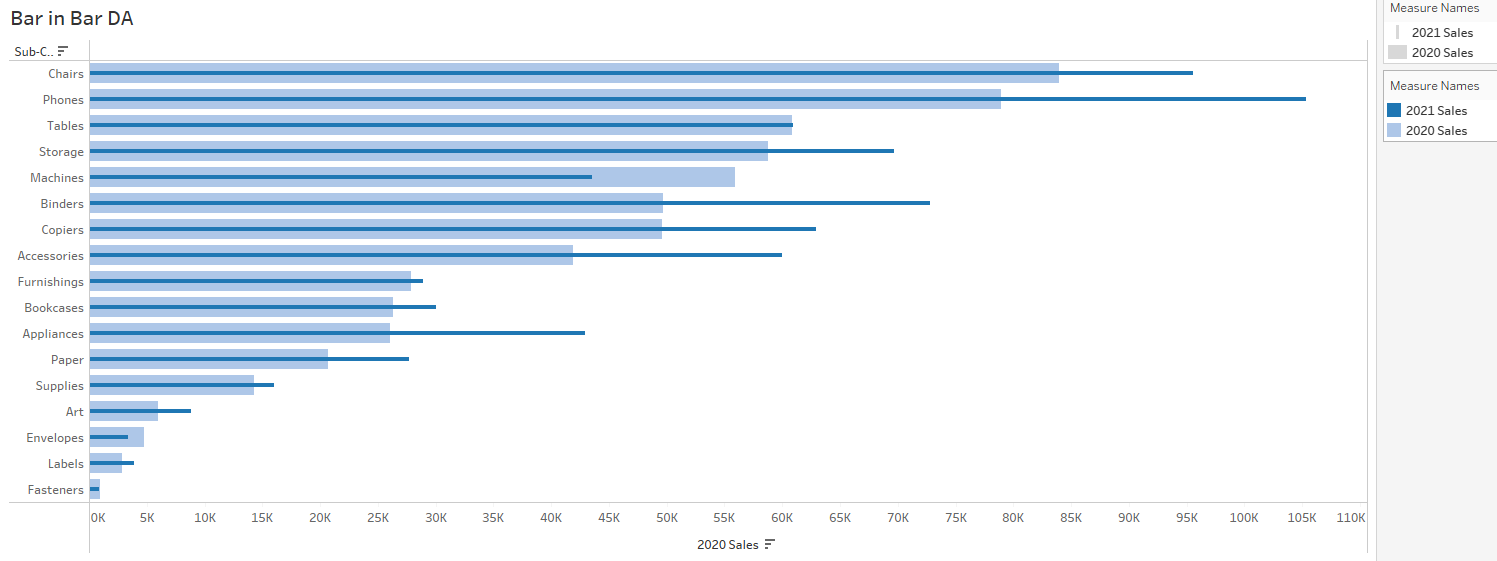
For bar graphs that's about it, they are just amazing at comparing two values and giving very quick visual context.
On that note, I shall end this post and thank you for reading. :)