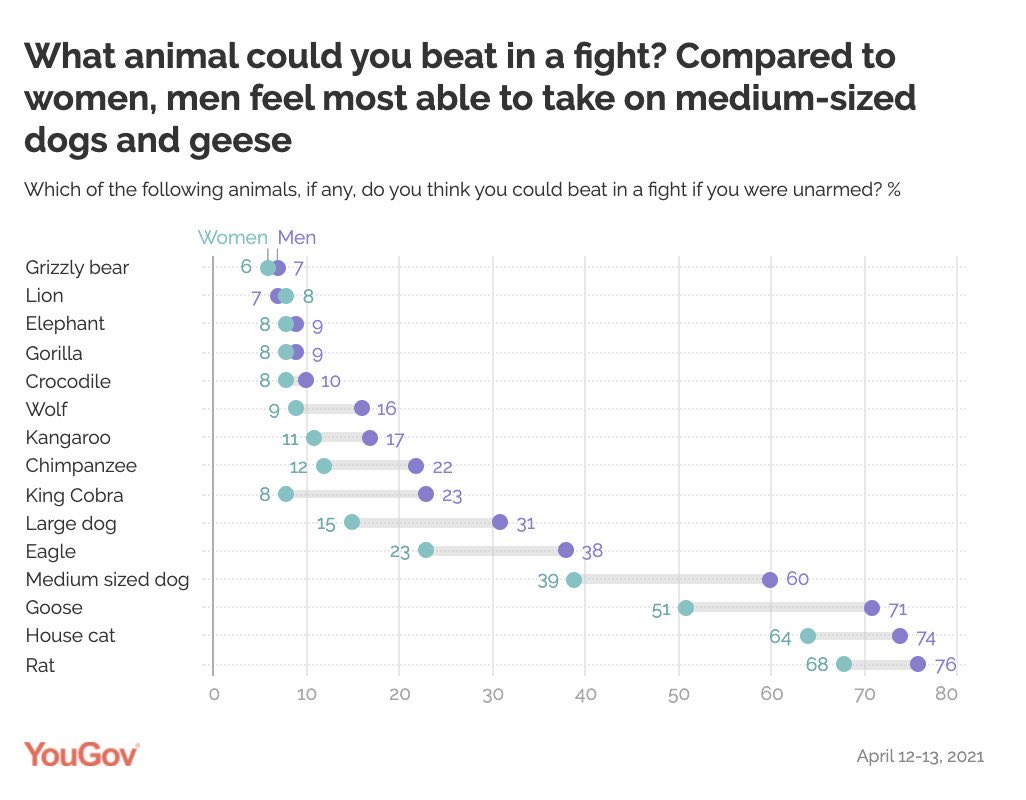
For the end of our week 2 training, we had to do a #makeover Monday exercise. We've picked a dataset that we liked, I went with "What animal could you beat in a fight?" which was based on statistics where people answered what animal they could beat in a fight.
The initial visualization* was good as it showed the difference in confidence between men and women as to what animal could take on.

The graph itself used a simple bar chart, which is capable of showing differences between two points which are connected by a line helping the viewer to draw a connection. It is good but could also be improved by some things such as show the difference between men and women % on top of the line, and have an annotation above it to explain what it does.
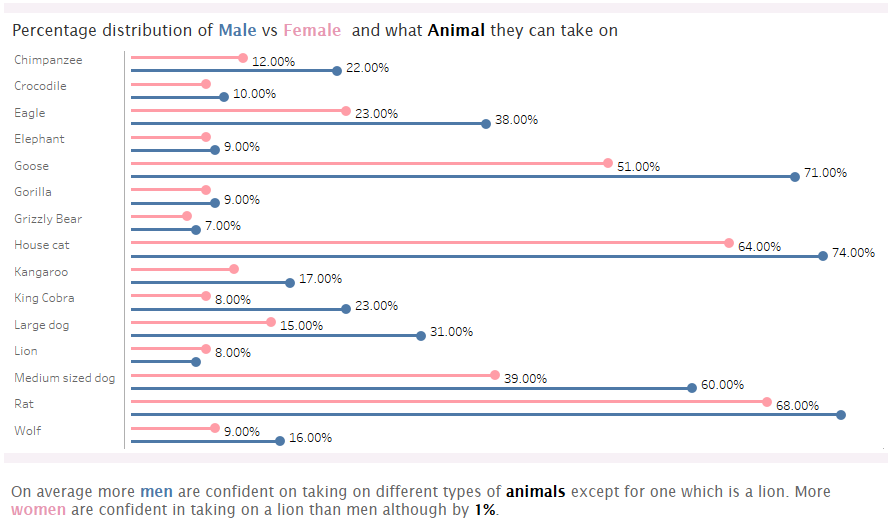
I have decided to go a different route to remake the viz in a lollipop chart (because who doesn't like lollipops :D)

Bar charts next to each other are a good way to show quick comparison between two metrics, while the use of colours helps to distinguish between the bars(lollipops) easier.
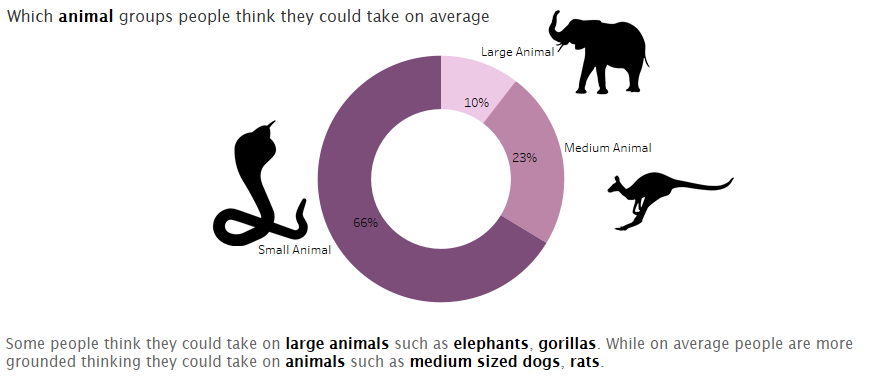
Another thing I thought would be fun to supplement the graph with grouped information, for example taking different animals and using homo sapiens as a base metric for sizing groups. Therefore I grouped the different animals into small, medium, and large and created a donut chart based around that.

This gives insight into what kind of size of animal people are confident in beating in a fight, which gives us more insights in human behaviour in a way.
Overall doing the #makeovermonday was a lot of fun and allowed me to tackle different challenges such as understanding what the initial graph is trying to portray and how to improve upon it.
For the reader, if you ever do try out doing makeover Monday challenges I do recommend to first think about the Viz and data, use something like excalidraw to sketch out your ideas as it will make the whole workflow a lot easier. Do not be afraid to experiment, as this will give you insights in what you're capable of doing and what might come off as harder. For me creating the donut chart and putting the % in the middle (which I did not manage to do in the timeframe given) made me understand that I need to brush up on some techniques in creating charts. In the end don't forget to just have fun and enjoy yourself.
Thank you for reading
