


There's an easy way to create a dynamic symbol/indicator for KPI's which would change based on values. For example, if I wanted to show the difference (positive/negative) between two values (Year over Year sales).
One could use symbols such as ▲▼ to show whether the sales grew or underperformed. This can be achieved through number formatting.
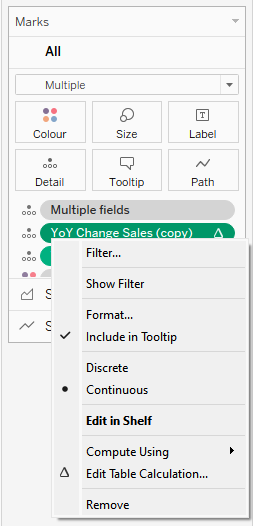
We need to right click on the field we want to have the dynamic values, and press "format..." (Ex. 1)
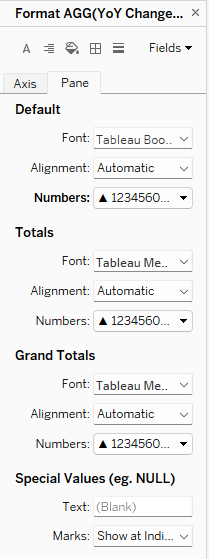
Once in format window we need to change from axis to pane, and click on the "Numbers:" (Ex. 2)
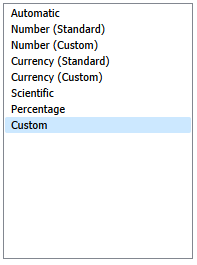
Choose "custom format" in the window that opened up (ex. 3)
Afterwards in the "Custom" pane under "Format:"
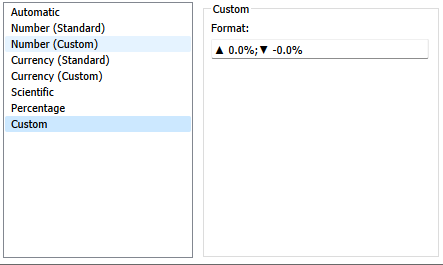
The format allows us to have custom format depending on the numbers separated by semicolon (;) the values on the left side would represent positive numbers and values on the right side of the semicolon would represent numbers which are negative values.
This way whenever we change the filters the number would change respectively and the dynamic ▲▼ would appear next to the value depending on it (+-).
Thank you for reading