There are so many data sets out there on the internet available to us to do interesting work on Tableau. But sometimes the data is very messy that requires massive data cleaning before we can do anything with Tableau.
This is when Tableau Prep comes in handy. In this week I have tried to visualise the world trade data from the World Integrated Trade Solution with all countries' summary. But when you download it there are over 200 files (as there is 1 file for each country) and the format is quite messy.


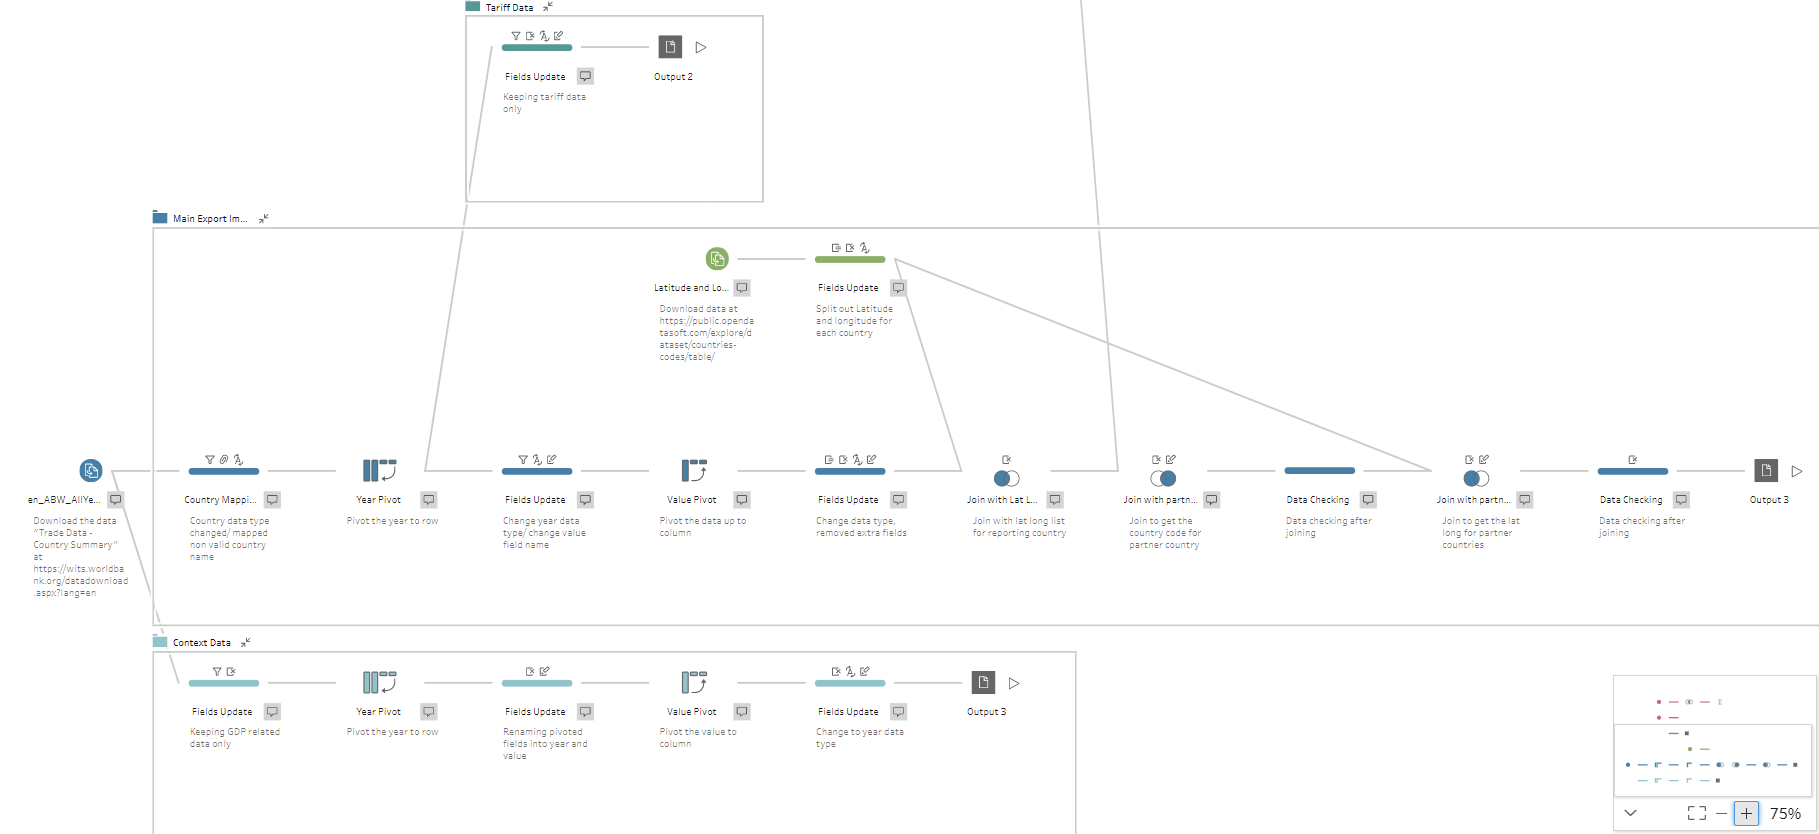
So I have used Tableau Prep to clean up the data for each file and made a dashboard out of the data. Here is what a Tableau Prep flow look like:
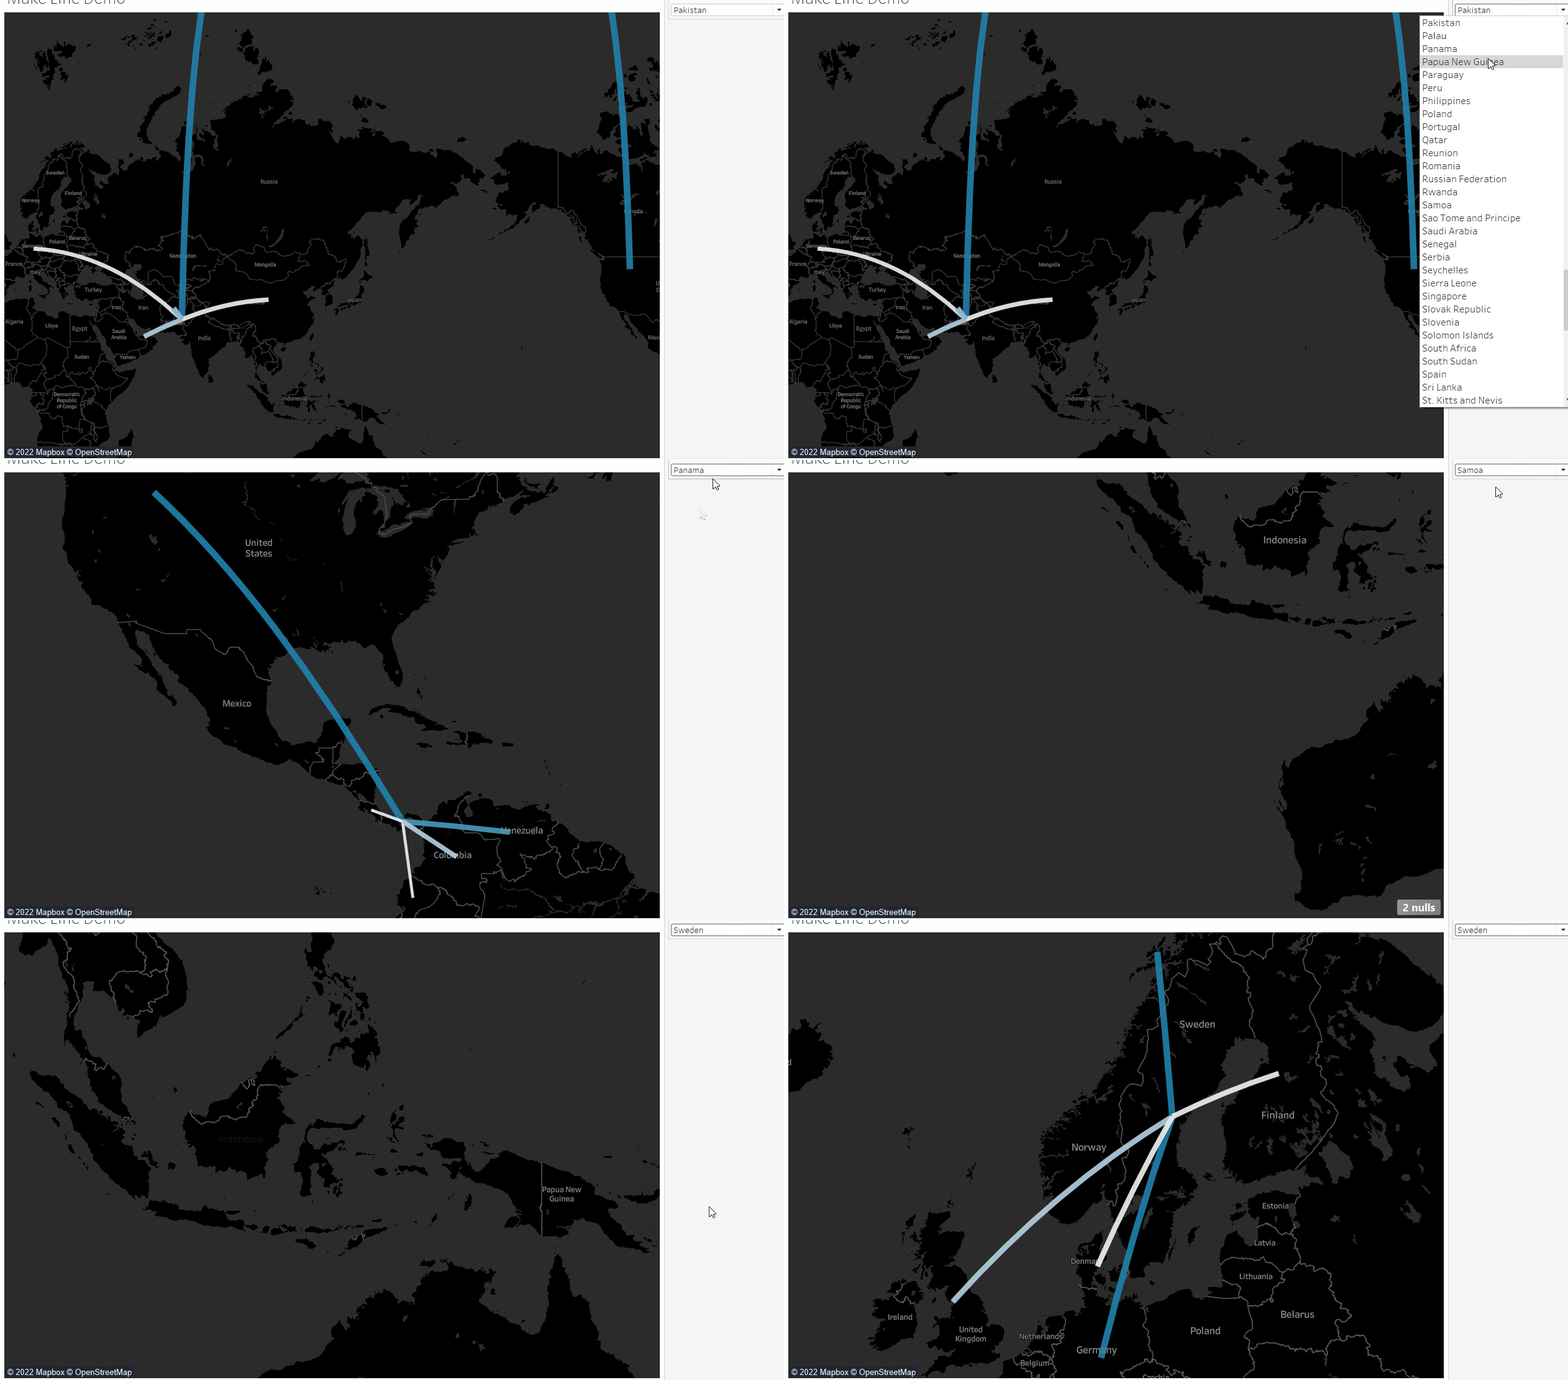
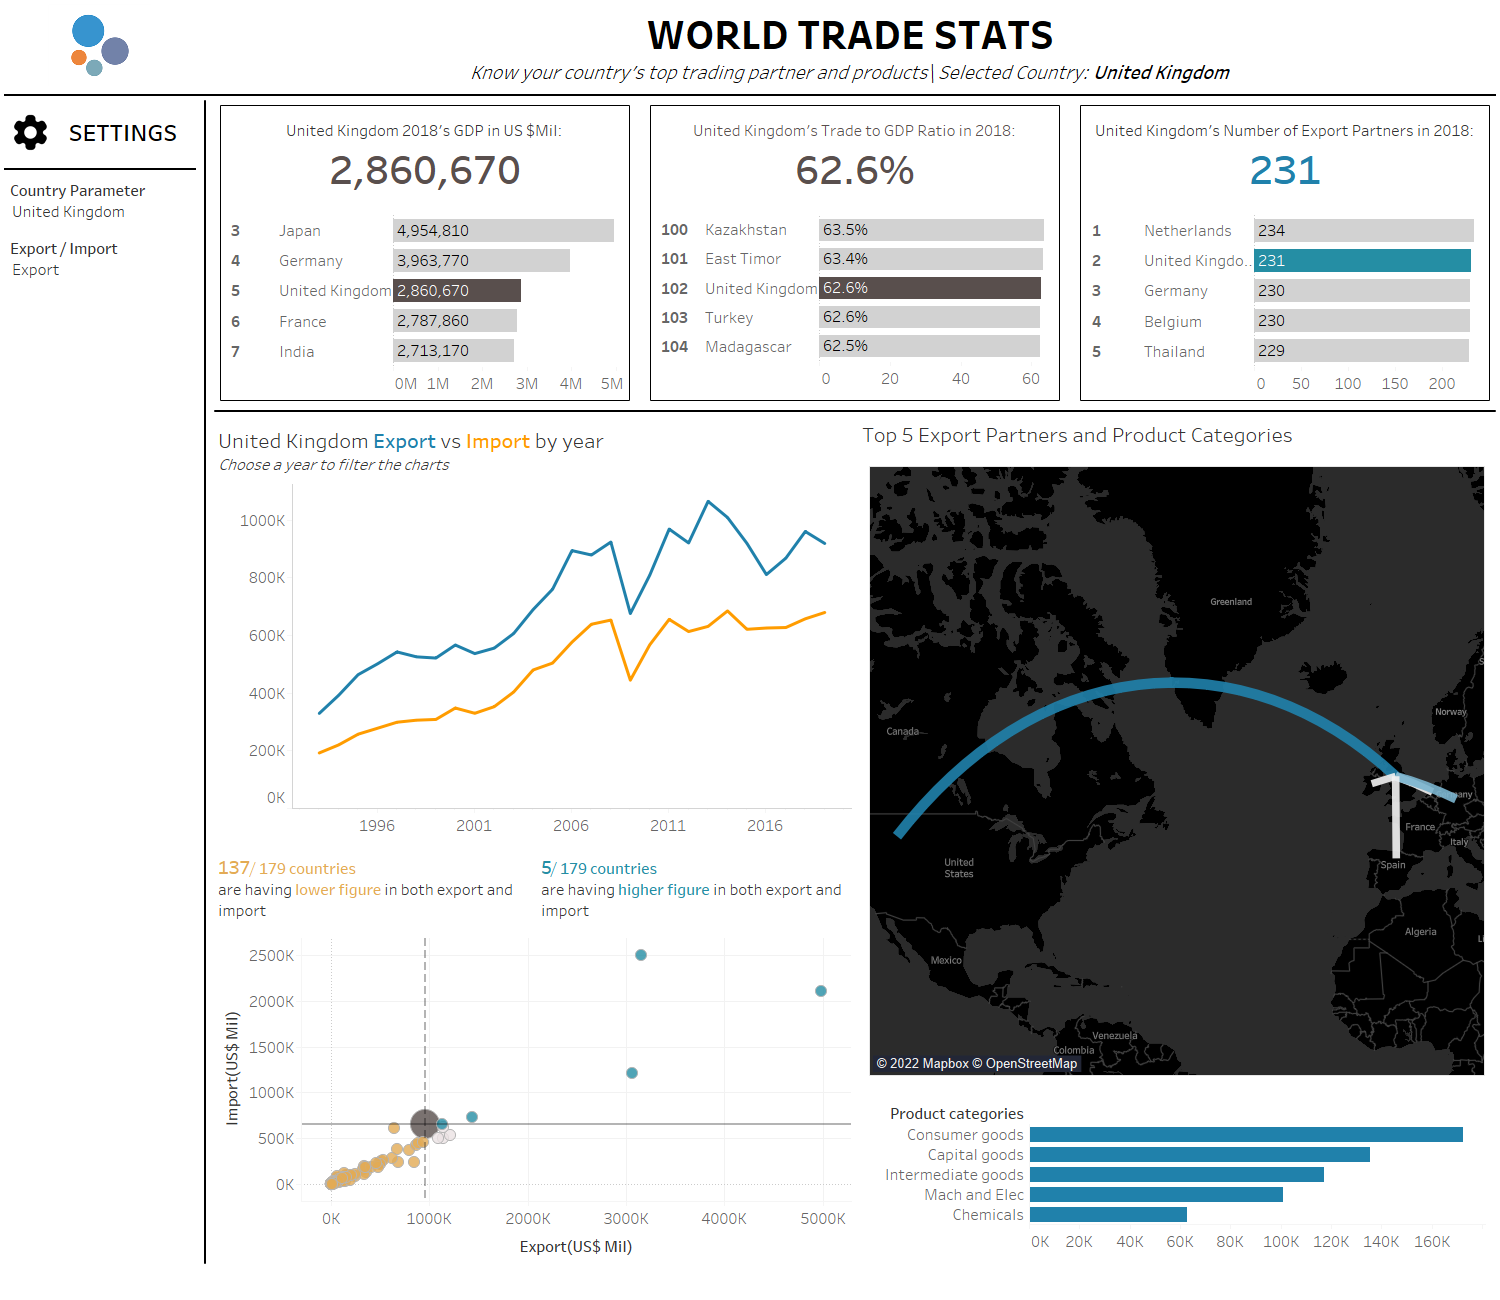
After cleaning the data with this flow we can do some interesting exploration like spotting different countries' export or import partners with Tableau's MAKELINE() function (it basically connects 2 points with their latitude and longitude).
What does this Tableau Prep flow do?
I will walk through a few key points in the flow. Firstly there is a wildcard union so it can pull in every country's file and union them into 1 big table.

After that it will pivot the year from column to row, as it is more Tableau friendly which is going to be helpful for analysing different years' data more easily.
The Prep flow is also splitting the data into 3 paths. As there are data for export, import, GDP and tariff. So you can see there are 2 paths diverging out of the main flow.

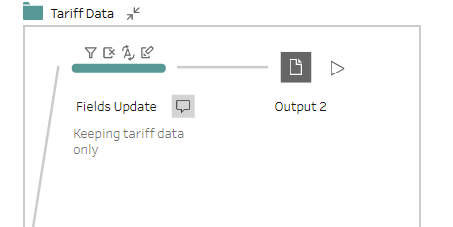
And then it is a bit of cleaning up, removing unnecessary fields and mapping some countries' name to be recognisable by Tableau (some still couldn't be recognised though).
I have pulled in another set of data which is the latitude and longitude of every country from opendatasoft.

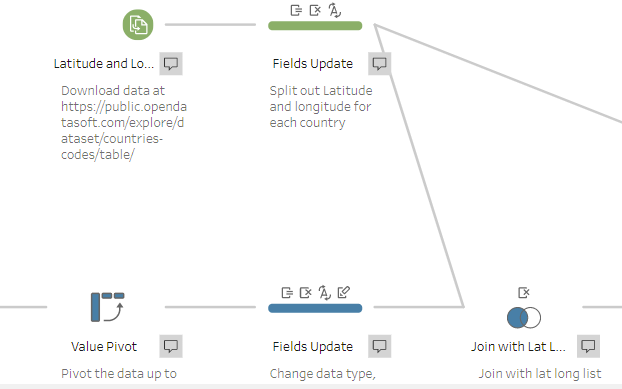
The green bubble is the data from opendatasoft and after that is a bit of data cleansing. I am joining by the 3 letter country code (extracted from file path, quite a neat function from Tableau Prep) this time because this is an external file and it would take ages to make sure the countries name on both sides are the same. So mapping with country code saves me quite a lot of time. By joining this I now have the latitude and longitude for having reporting country.
Now it is a bit of a tricky part. As every country has their own export and import partners. We will need to get the lat and long for the partner country so that makeline function works. We will need to pull in the trade data again in another path. Do a bit of self join in order to get a unique list of country code for each partner.
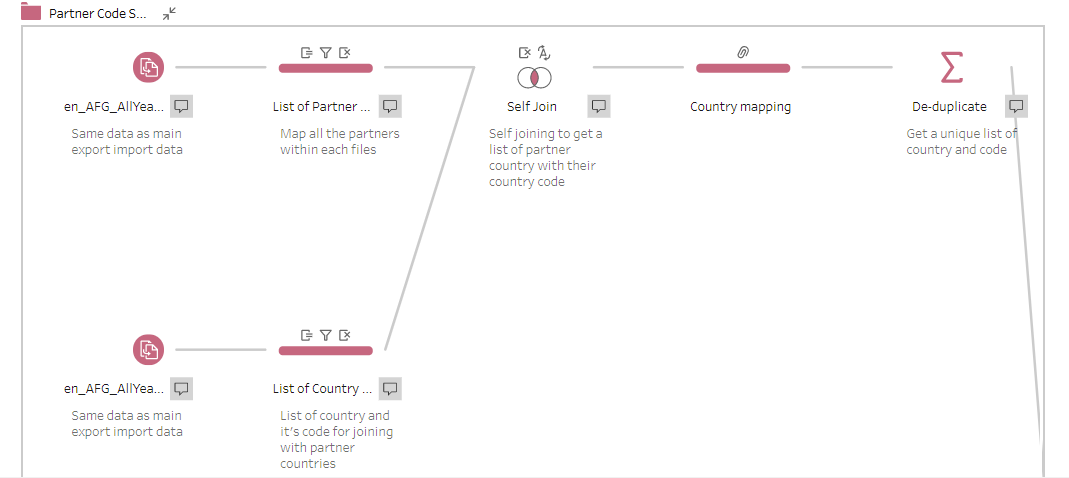
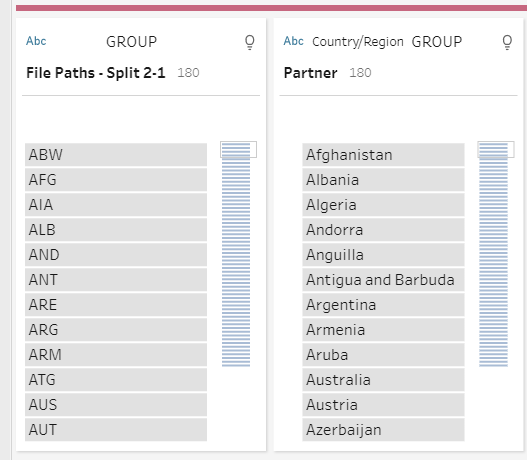
And then it is another join, joining the partner country code with the partner inside of the main flow. The country code allows us to map with lat long with the opendatasoft data again for the partner this time.
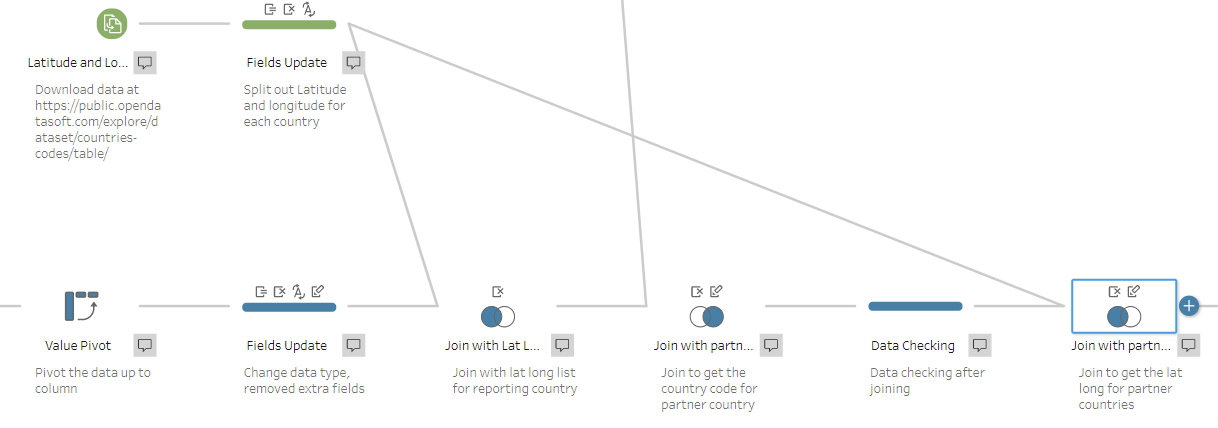
So the flow is basically done! Now it is time to output those data. So in this flow you could probably see there are 3 output anchors in the end of each paths. They are all pointing towards 1 file and will write their each into different sheets.
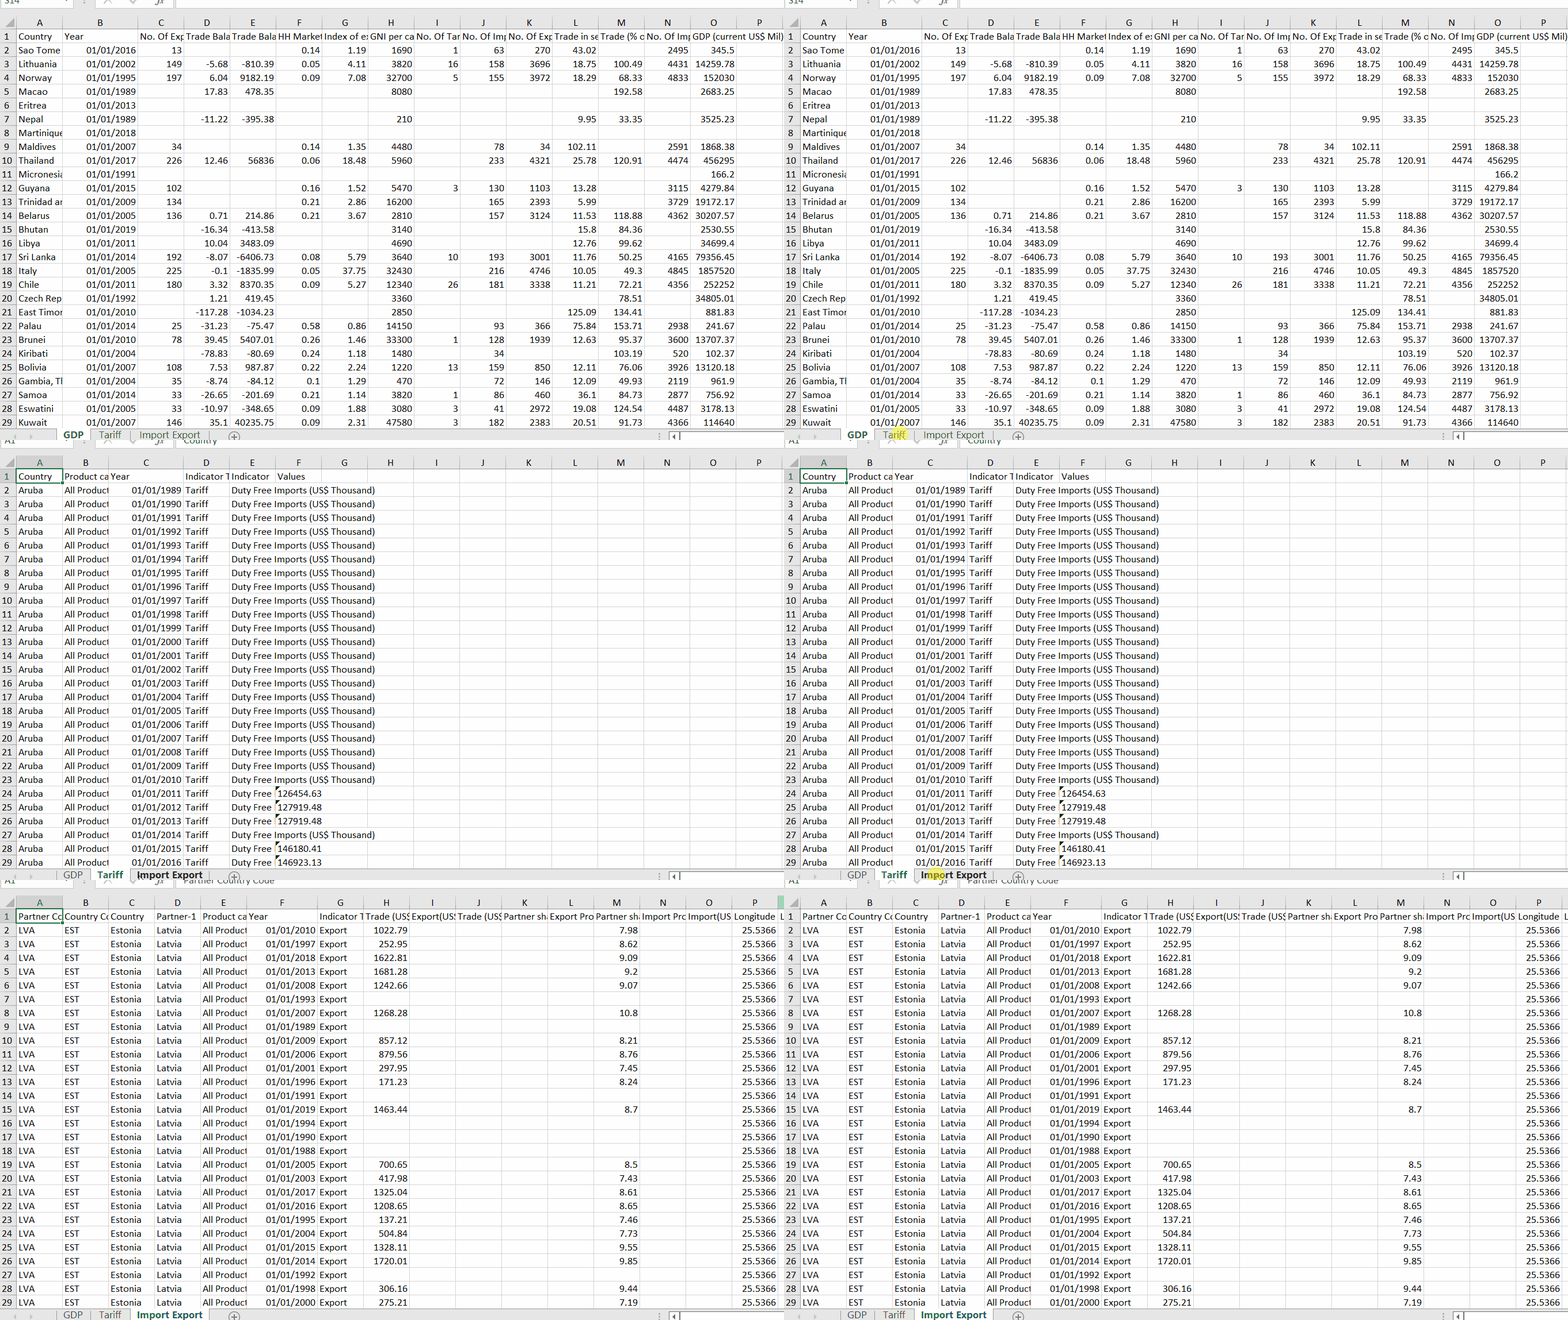
Above you can see the output data is now in 3 different sheets. For my dashboard is using the "Import Export" and "GDP" sheet. And we have our clean data for import export partner, GDP and trade ratio data line up quite neatly.


So this is it! This week has been fun using Tableau Prep cleaning up the data. And it is quite nice to know that messy data can be cleaned in such easy way.
