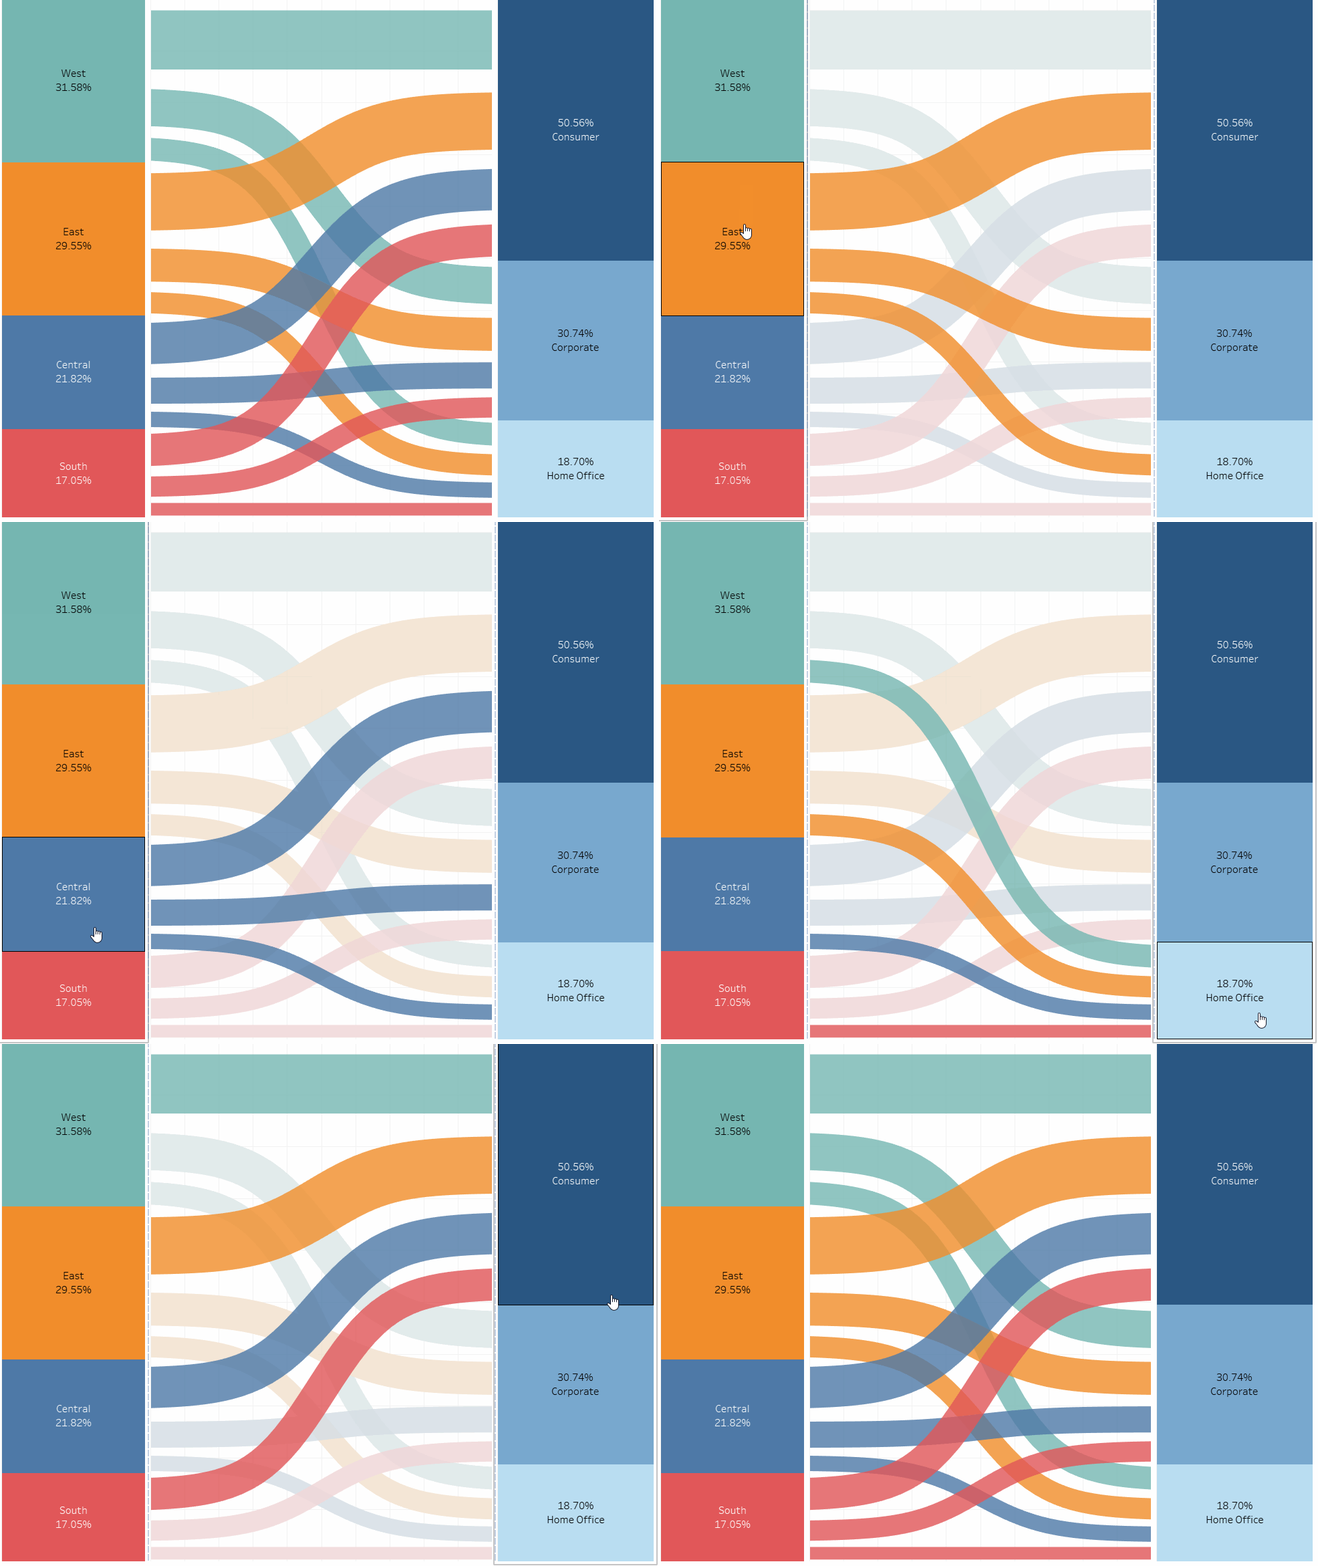
Sankey chart might be something in your the Tableau "bucket list" of yours, a chart type you have been wanting to try to build but it seemed daunting. But in fact it is easier than you expected. Plus it is a great a way to demonstrate the flow of a measure across 2 categories. So this blog will guide you to build a sankey chart step by step.
In order to build a sankey chart there are number of calculated fields you need to create. So please feel free to follow along.
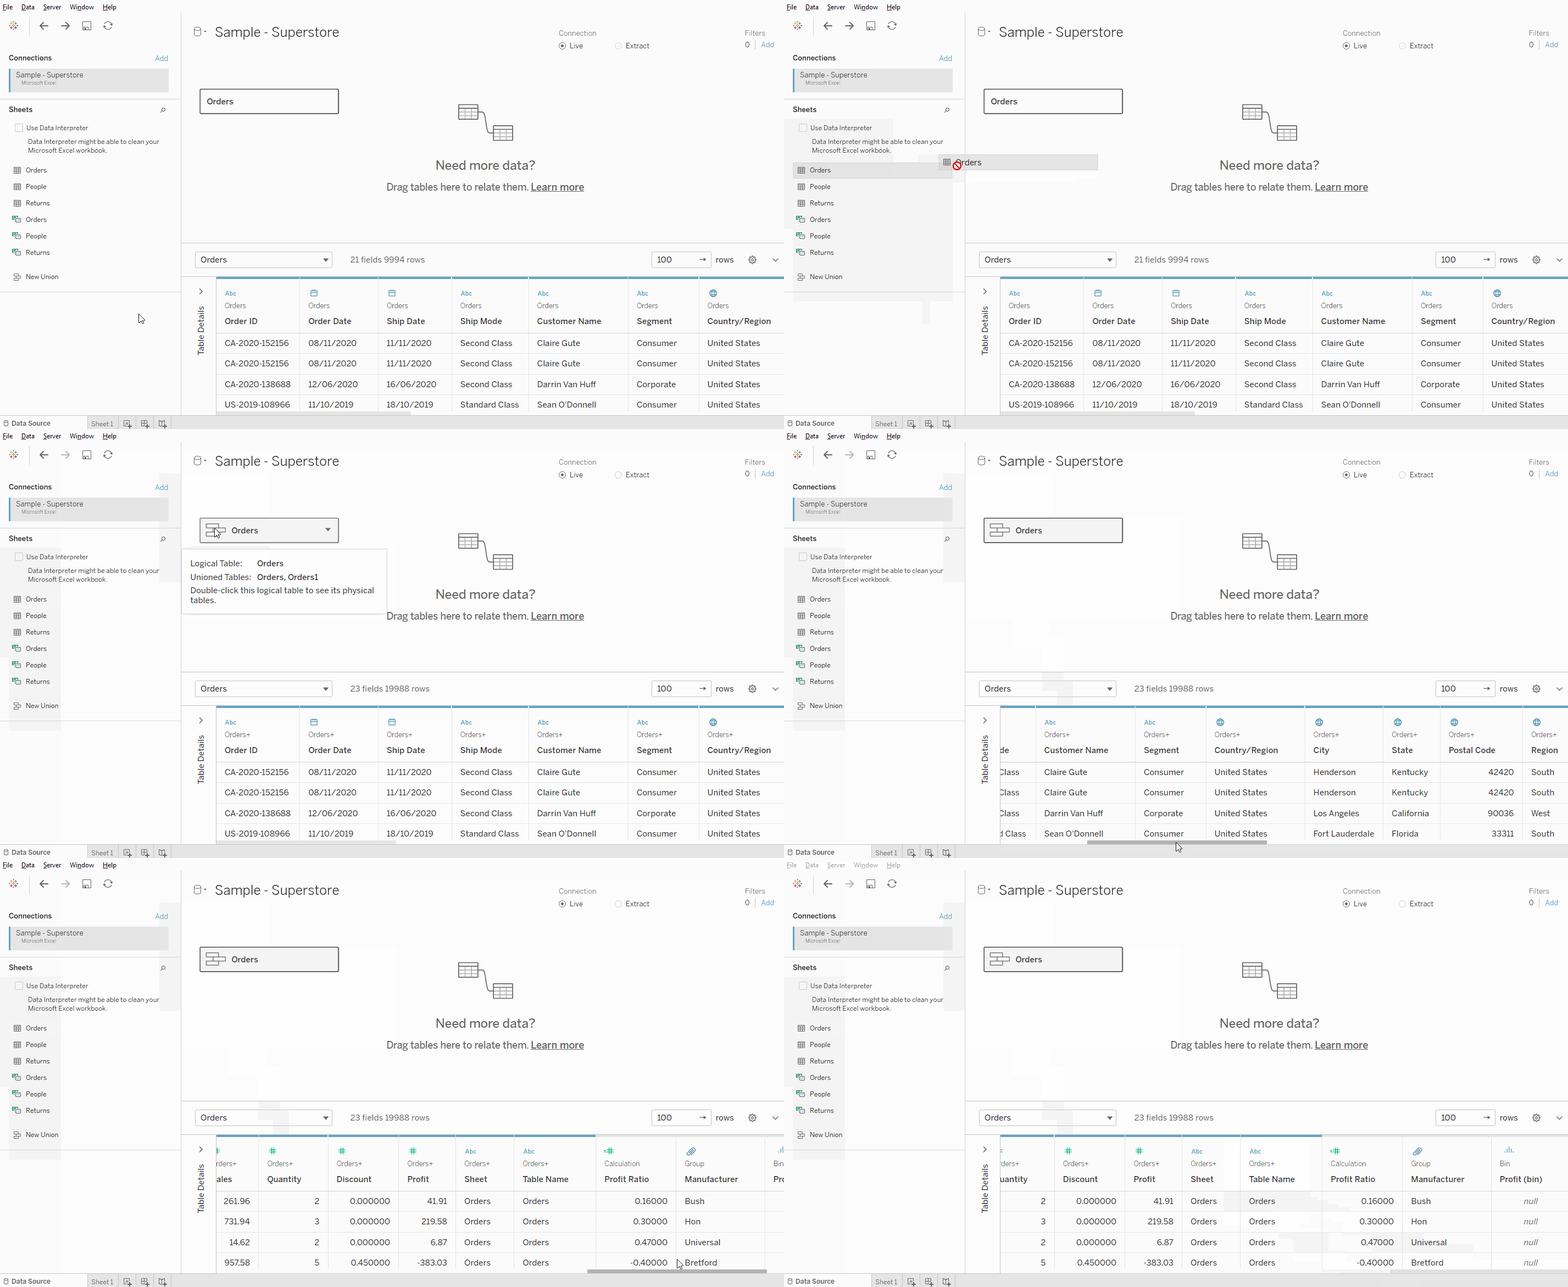
- You need to create a union with the exact copy of your original data
In this case I am using Sample - Superstore dataset and the Orders sheet along. So I need to drag the "Orders" underneath the original data source to create a union. The reason why we are doing this is because we need the "Table Name" field computed automatically by Tableau after a union.
2. Start creating the calculated fields
Step 1: Create a "To Pad" calculated field.

If you do not know the what your data's table name is. You can simply go to the "Table Name" dimension on the data pane (on the left). Drag it onto the view and have a look what the name is. Usually the union-ed one would just be the original one with the "1" appended behind.

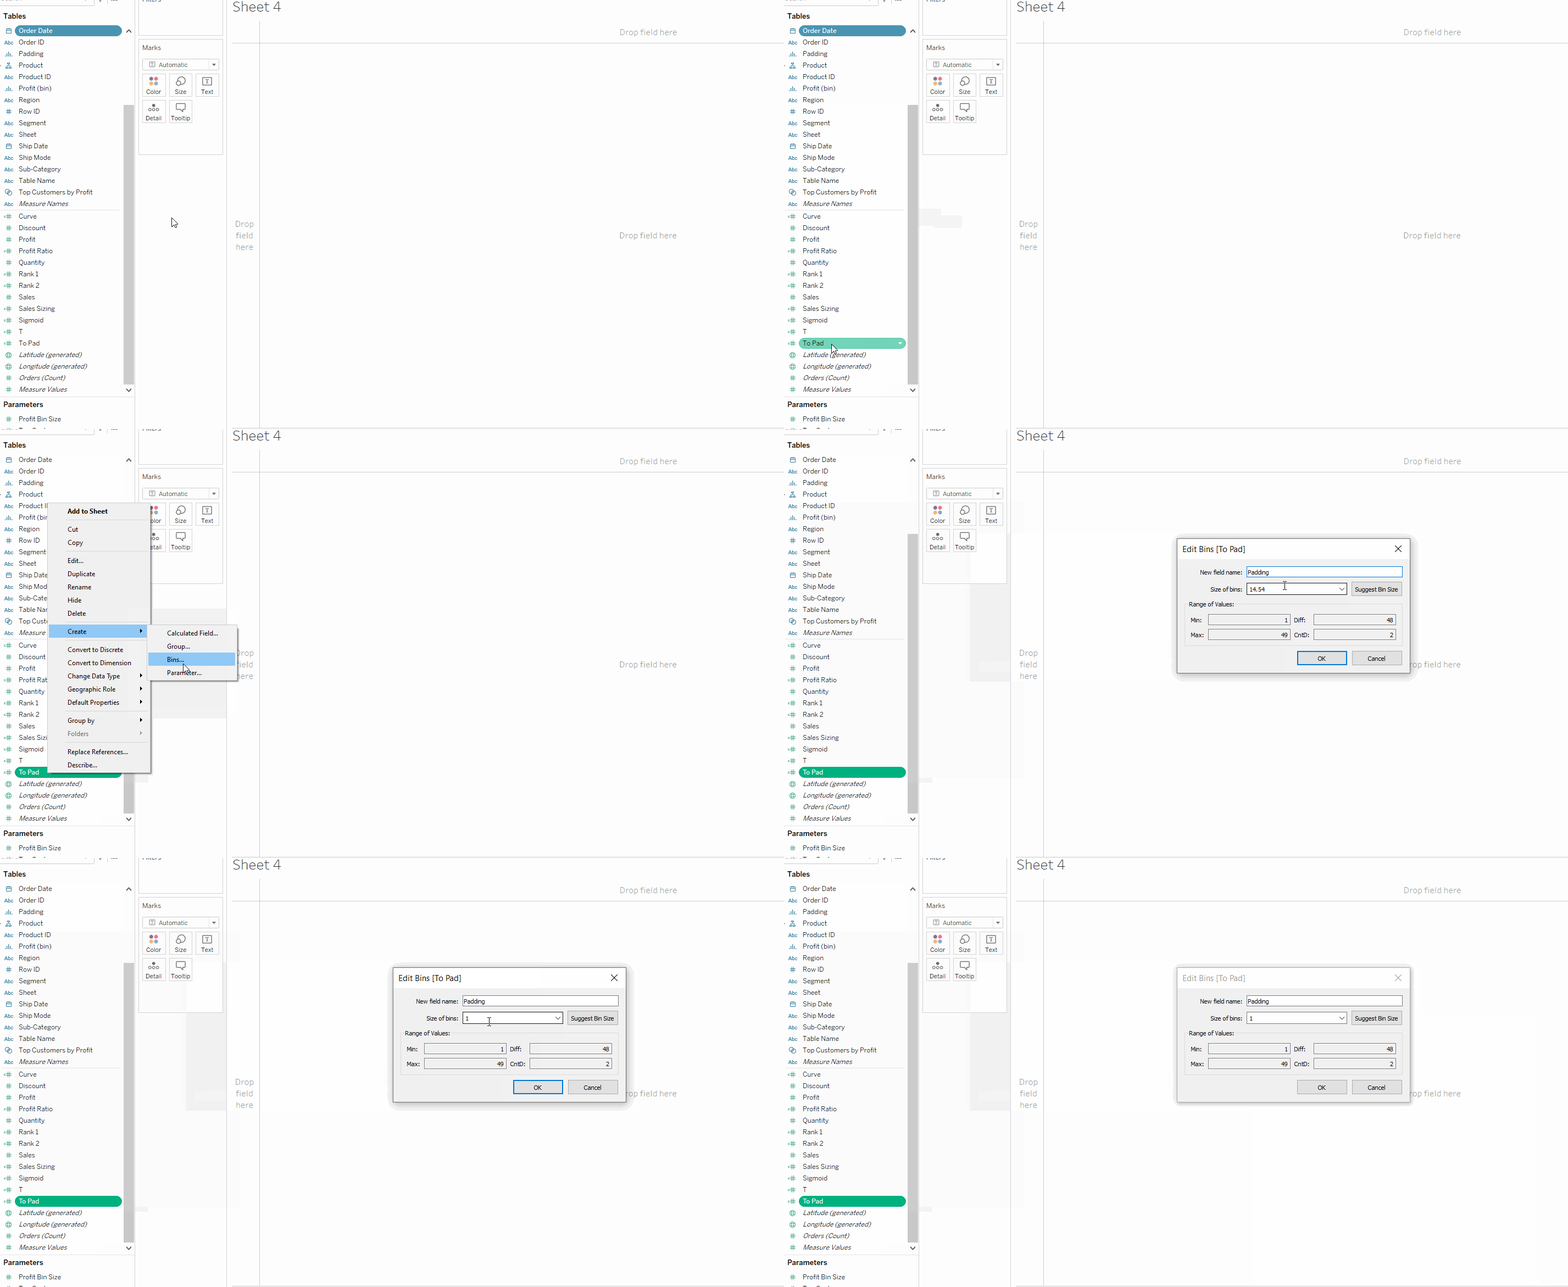
Step 2: Create a bin for the To Pad field
Since from step 1 we have created 2 values: 1 and 49. But there is no value in between. So we will need to create a bin in order to fill the gap.
Step 3: Create a new calculated field called T
This calculated field is to make sure the sankey mark can be spread out across the view. Formula as below, you will notice it is a table calculation. No configuration need to be done for now. As we will configure the calculation dimension later.

Step 4: Drag T and Padding into the view
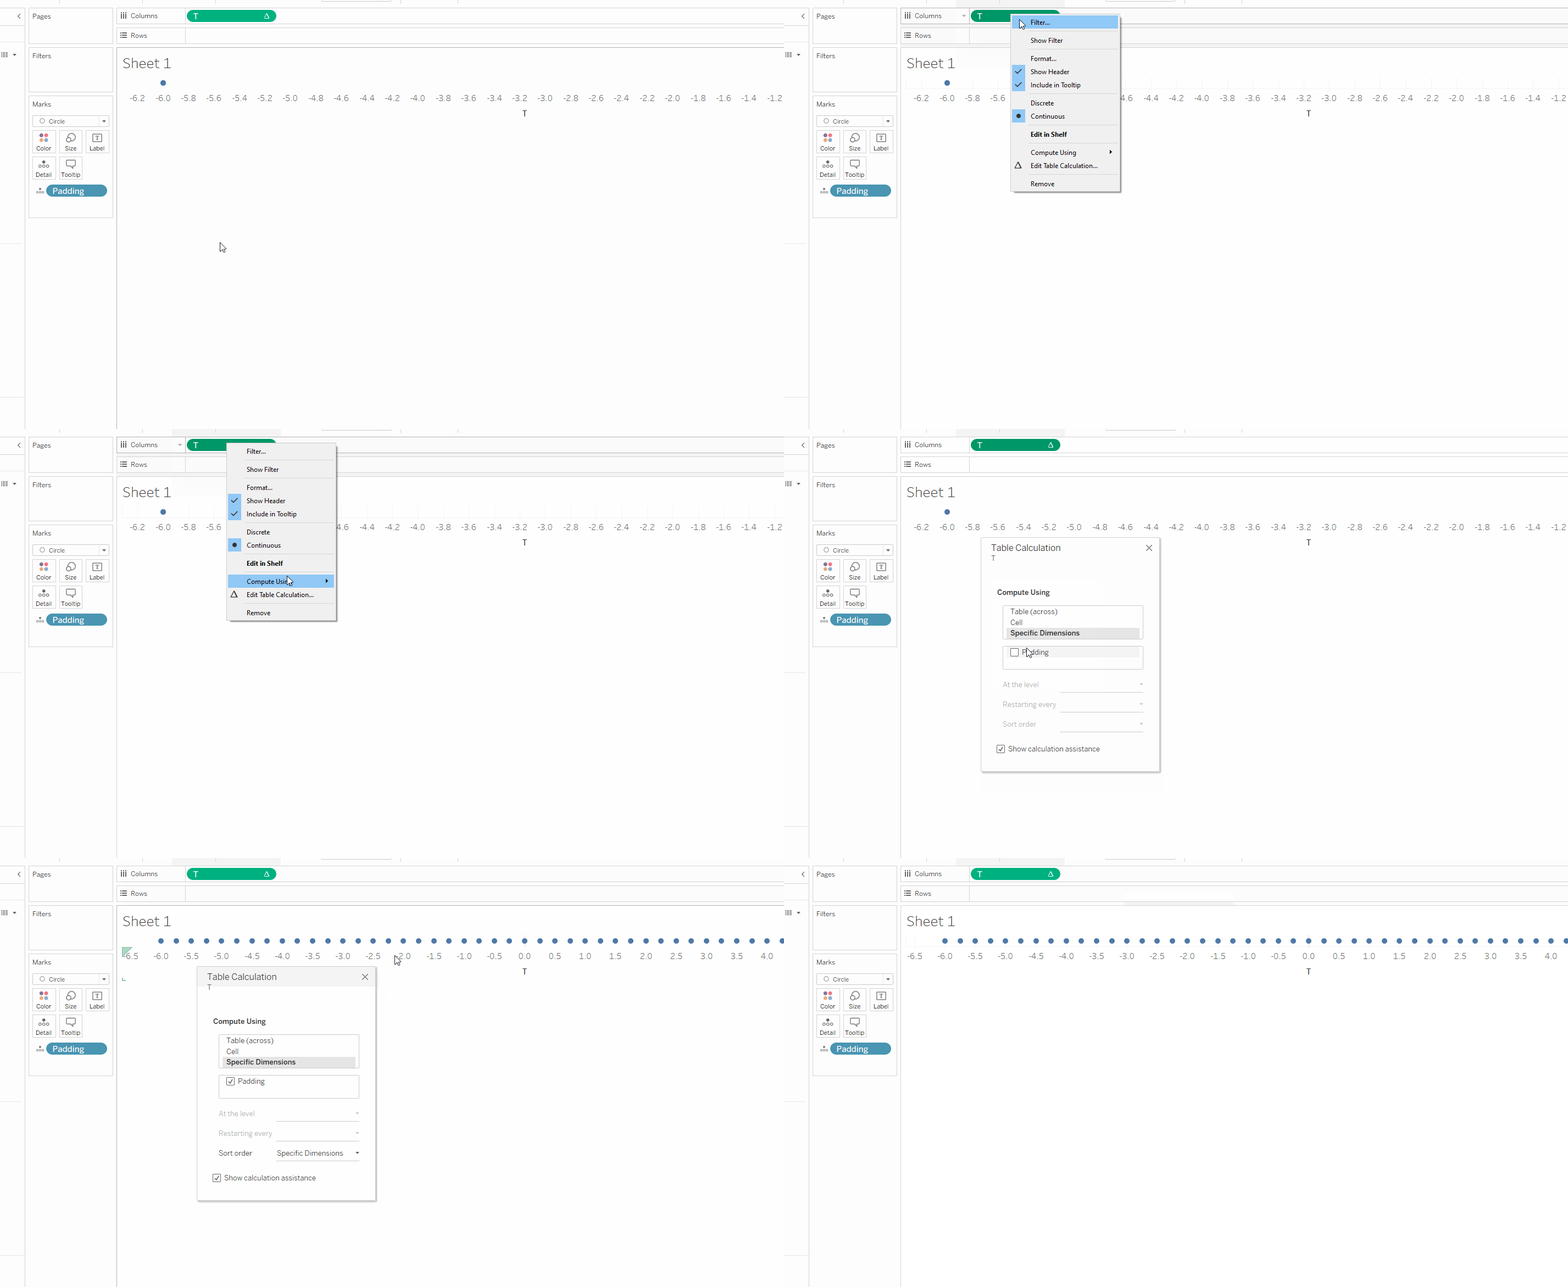
Drag the "T" calculated field from step 3 into columns. "Padding" into the details shelf. Then change your mark type into circle.

Next is to configure the "T" field to compute based on the padding. Right click on "T" and "Edit Calculation" and then choose "Specific Dimension" and check Padding. After changing the configuration of the calculation you should be able to see 49 marks instead of 1.
Step 5: Create 2 identical calculated fields as below
Create a calculated field computing the running sum of the measure you want to use (in this case: Sales) divided by the total sum of the sales. Again, you do not need to worry about the "default table calculation" setting. These calculation will tell Tableau about the start and the end of the sankey chart.


Step 6: Compute the sigmoid
The noodle-y shape curve of the sankey curve is a "Sigmoid" curve. So the below calculated fields will inform Tableau on how to draw the curve of the sankey chart.

Step 7: Combining all of the previous calculated fields as "Curve"
Now it is time to use all of the calculated fields we have created in the previous steps. This time we are calling this field "Curve"

3. Now we start building the visualisation
Whenever you want to build a sankey, make sure you know which 2 dimension you want to use. In our case we are using "Region" and "Segment"
Step 1: Sankey Chart
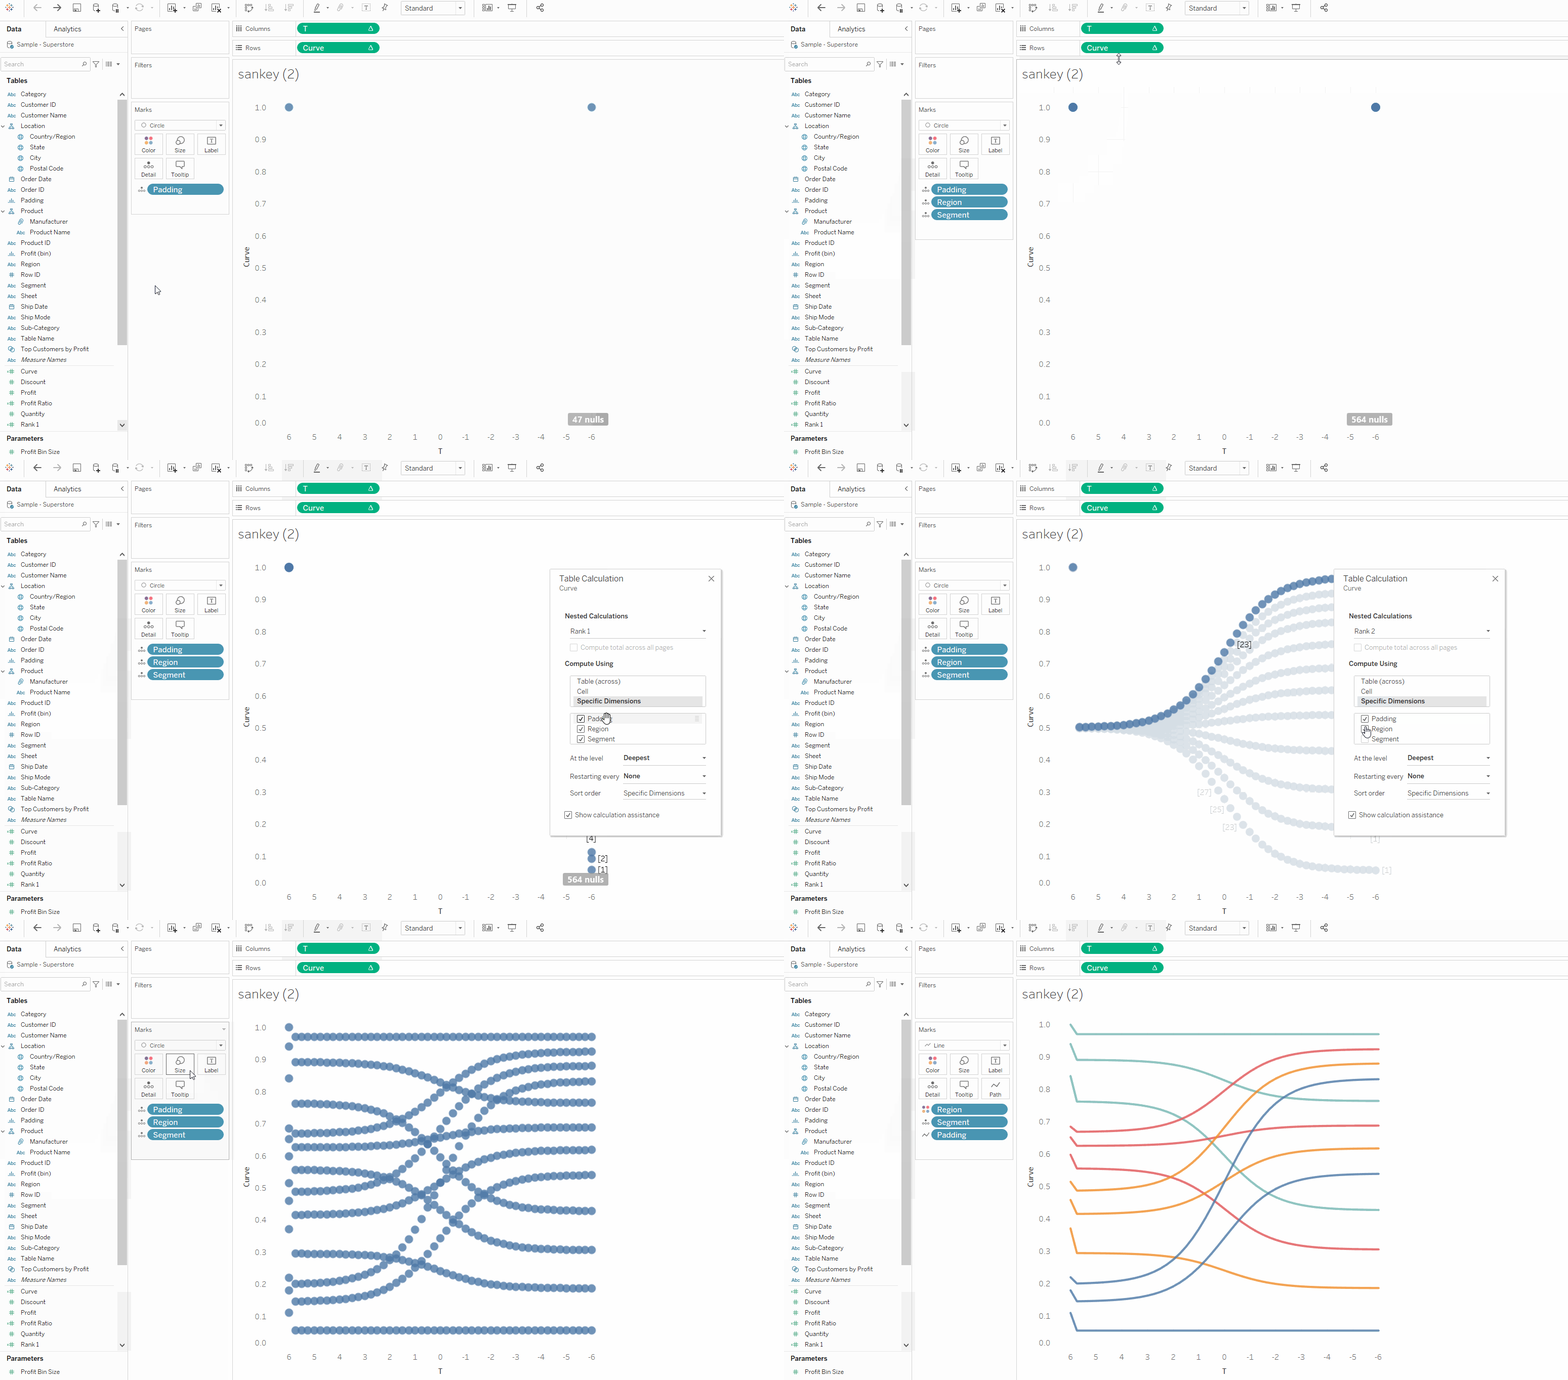
So in the sheet you currently have T and Padding in the view. Now drag the field "Curve" into the rows. And you will see something similar as below:

Currently it does not make any sense. But it will slowly become a sankey as soon as we add all those calculation in.
Step 2: Configuration the "Curve" table calculation* (IMPORTANT)
Now we need to configure the "Curve" table calculation. In our case as we are using Region and Segment. So we will drag those 2 dimensions into the details shelf. And configure them accordingly. This part is really important as this will affect how the sankey look.
Right click on the Curve field and edit table calculation, you will see a line called "Nested Calculation", this is where we configure how the sankey moves.
Step 3: Build out the 2 dimension as % of total calculation
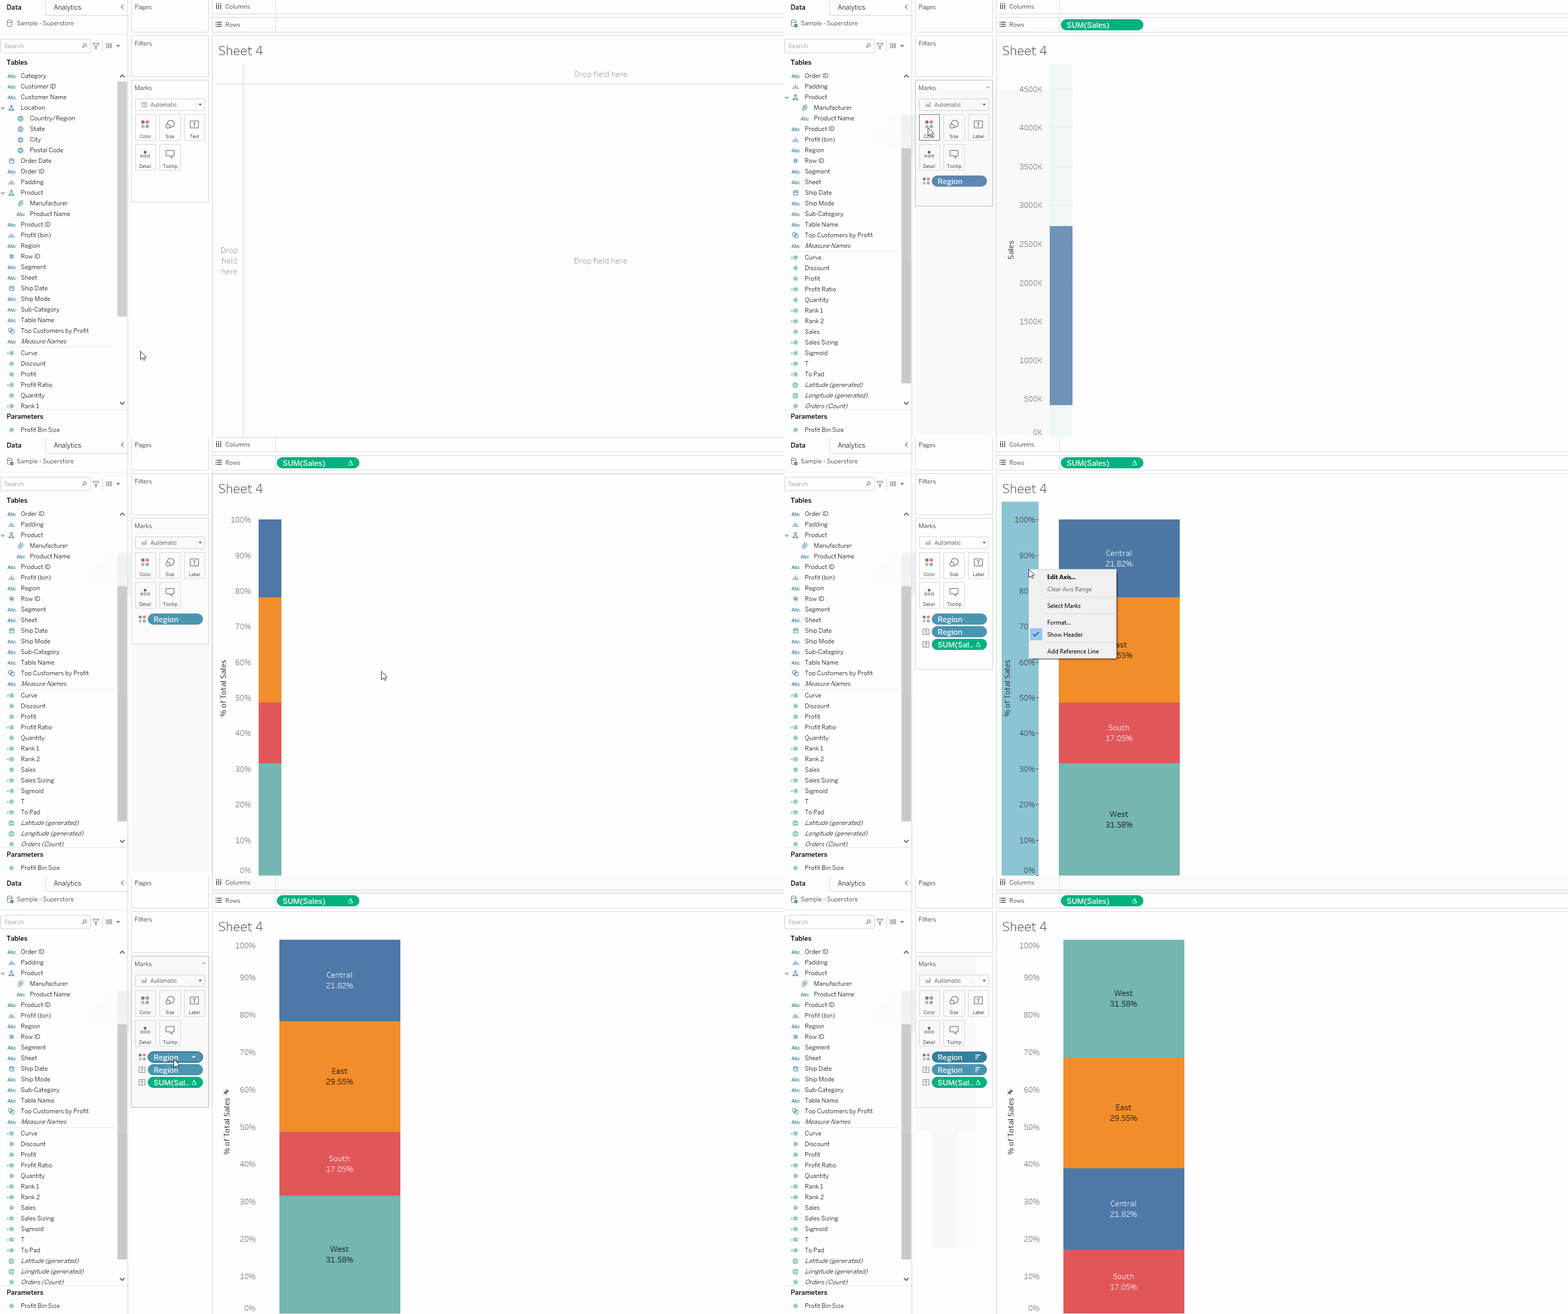
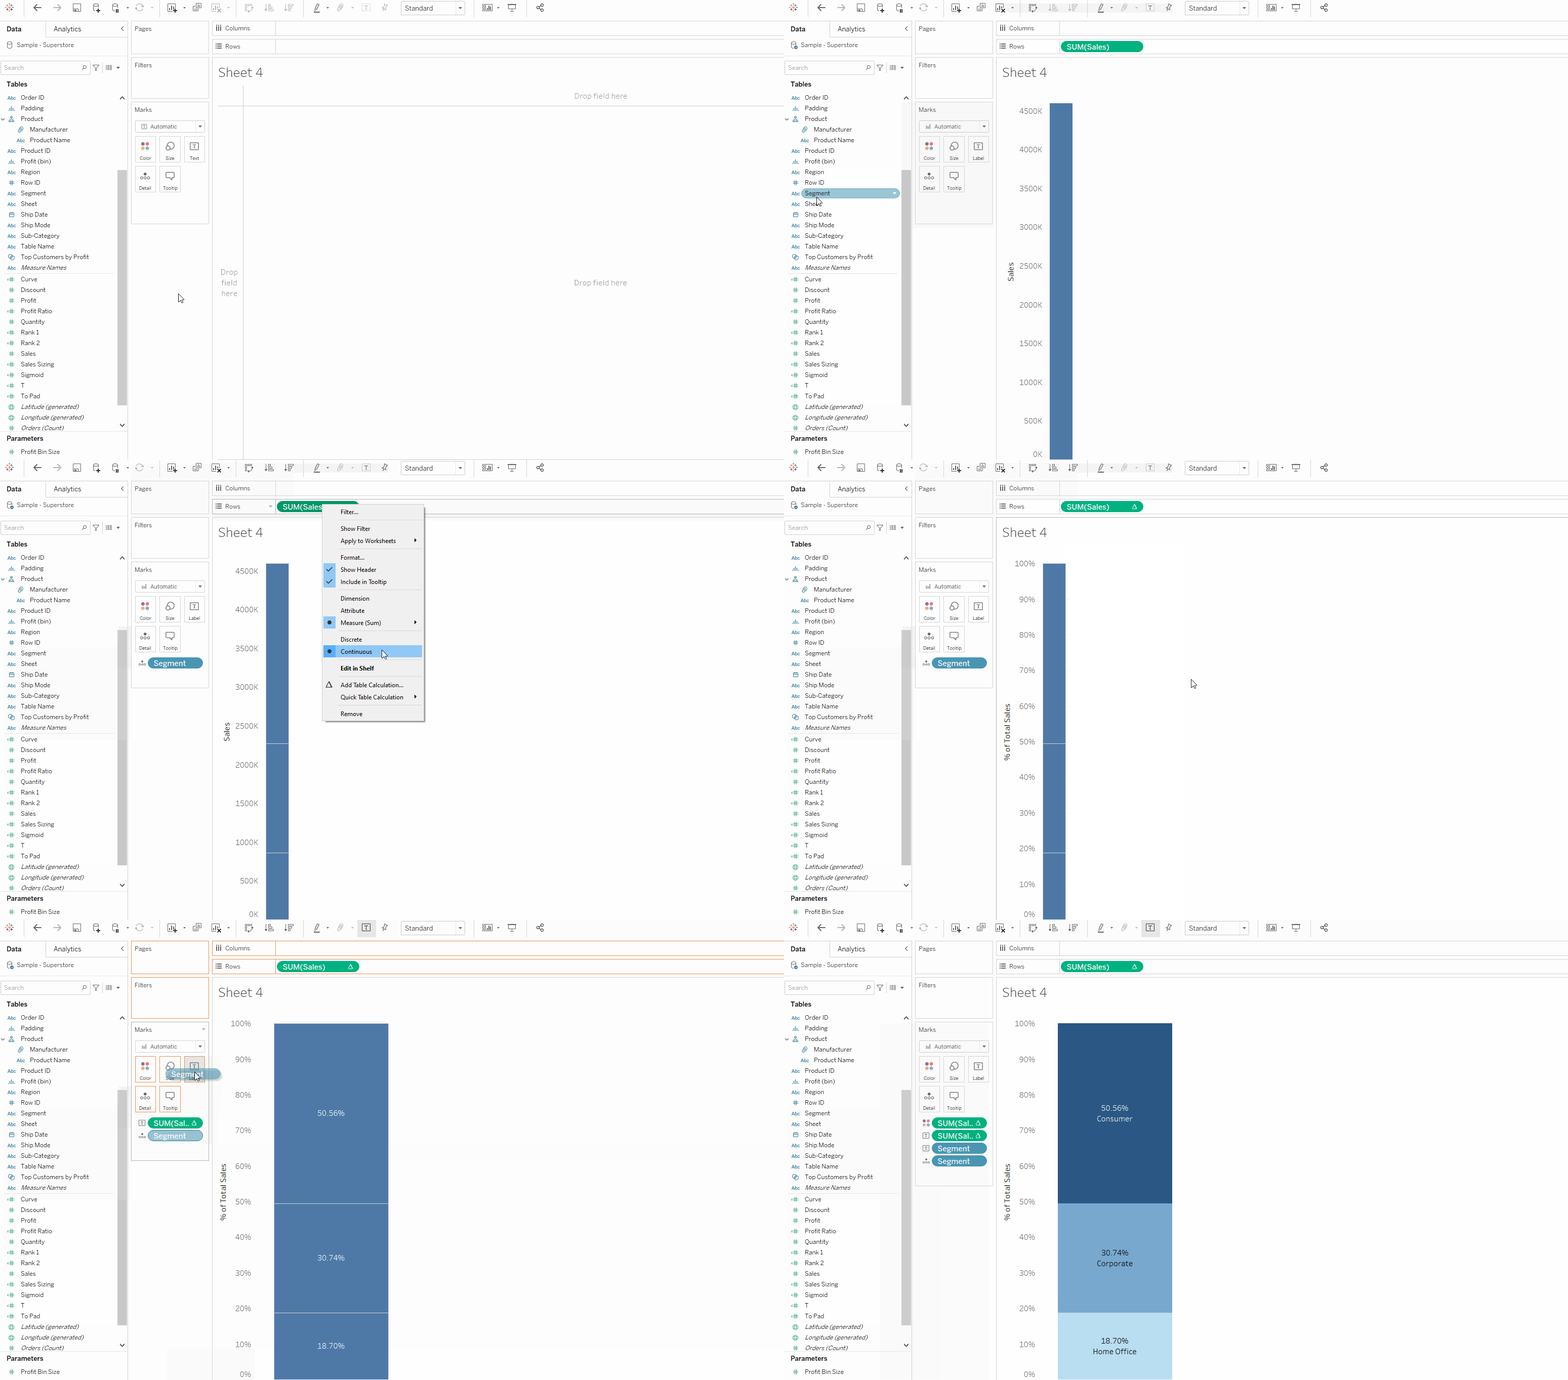
In our case we are doing Region and Segment. So we drag Region and Segment into details and sales into Rows. Change the Sales into a table calculation as "% of Total"
For Region I am dragging Region into colour. Sort the region in descending order. Also 1 more thing you need to do is to edit the axis from automatic to fixed from 0 to 1. That way you can have the whole bar chart from top to bottom without any white space.
For segment I am dragging the Segment into details and and Sales % of total as colour so I have a diverging colour scale. This way the colour is less busy but still showing sales distribution.
Step 4: Go back to the sankey, configure the line location
Now that we have got all 3 sheets with us. Now we need to do some final editing on the sankey. Right now the sankey is still looking a bit weird. That is because we will need to edit the axis.
On the X axis (T) I would fix the range from -5 to 5. And for Y axis (Curve) as we have to sort the dimension same as the previous 2 sheets. We have built. We will have to fix the range from 0 to 1 and reverse the axis.
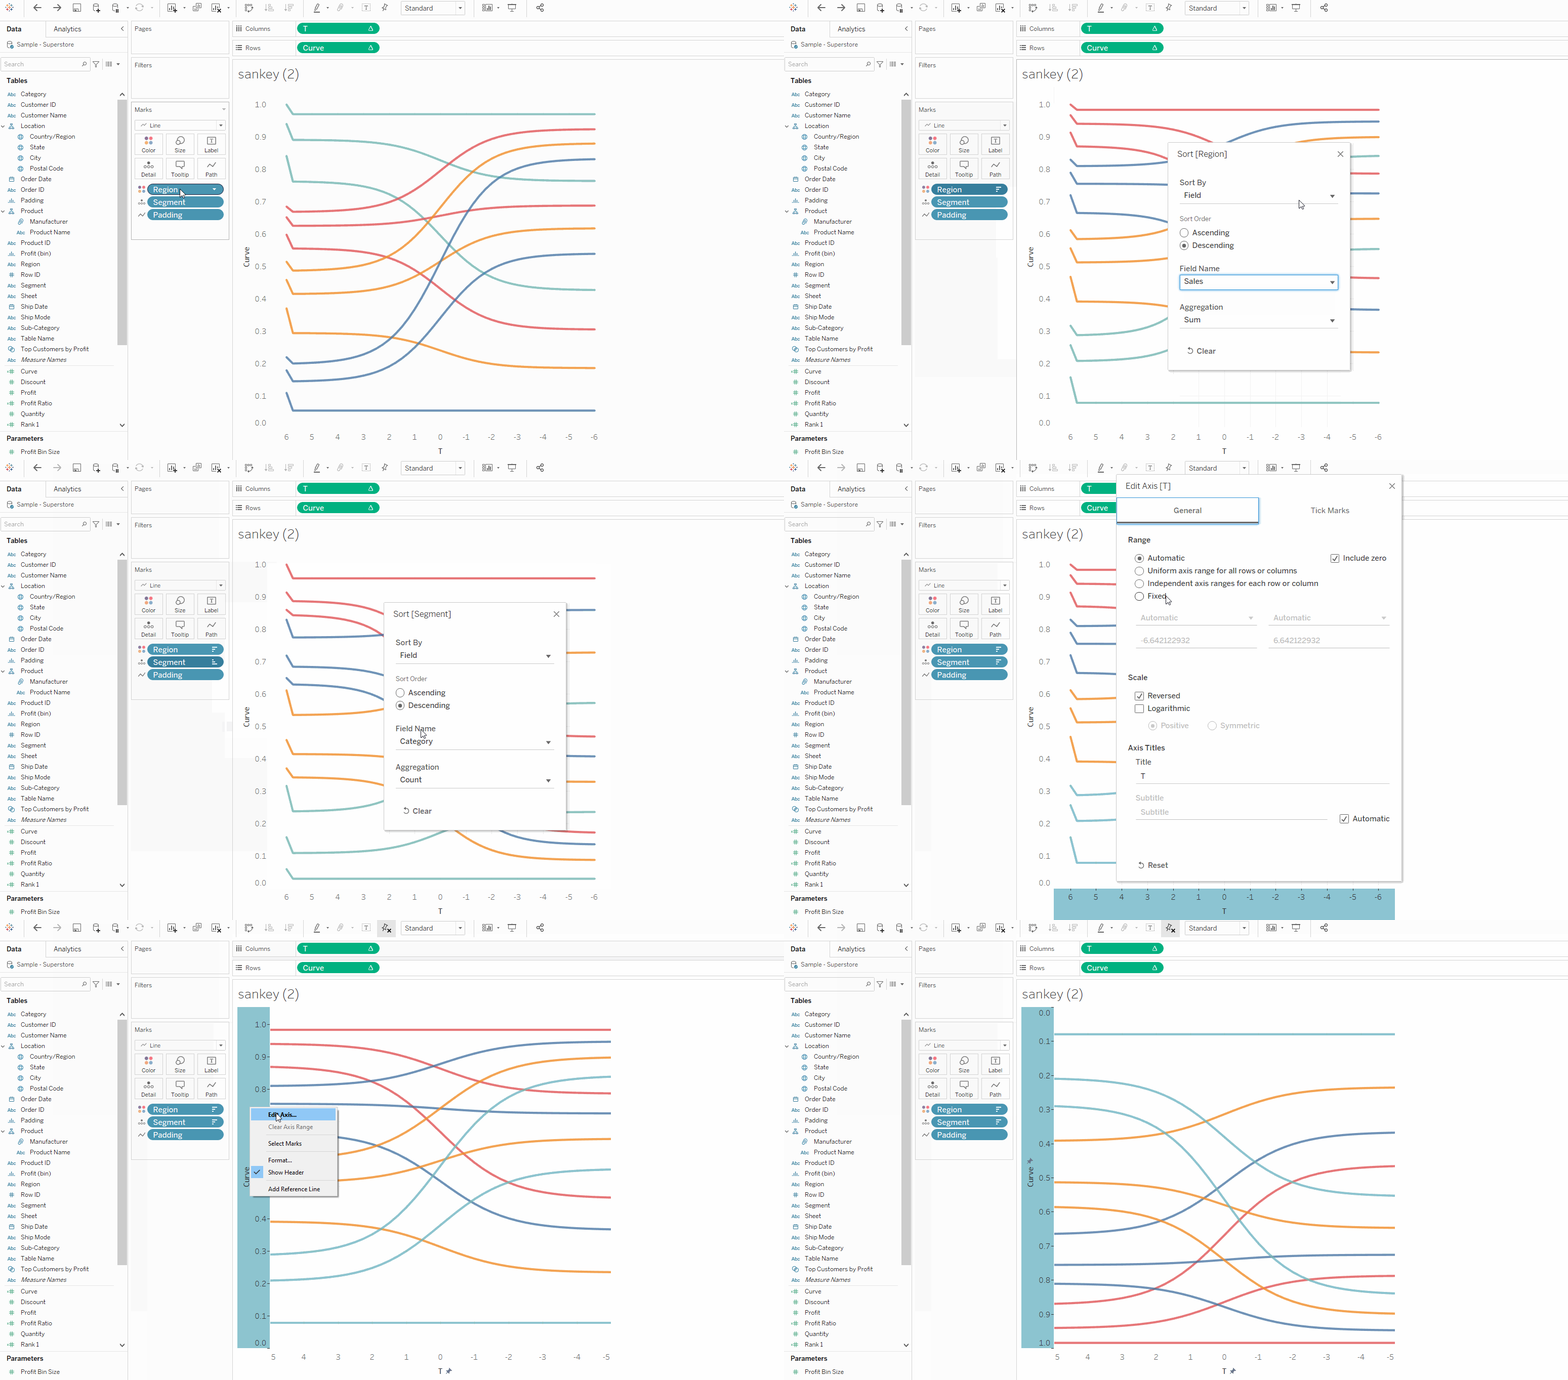
Hide the header afterwards and now the sankey is looking better.
Step 5: Last calculated field(promise) for the size of the sankey

Drag this field onto size and edit the calculation base on padding.
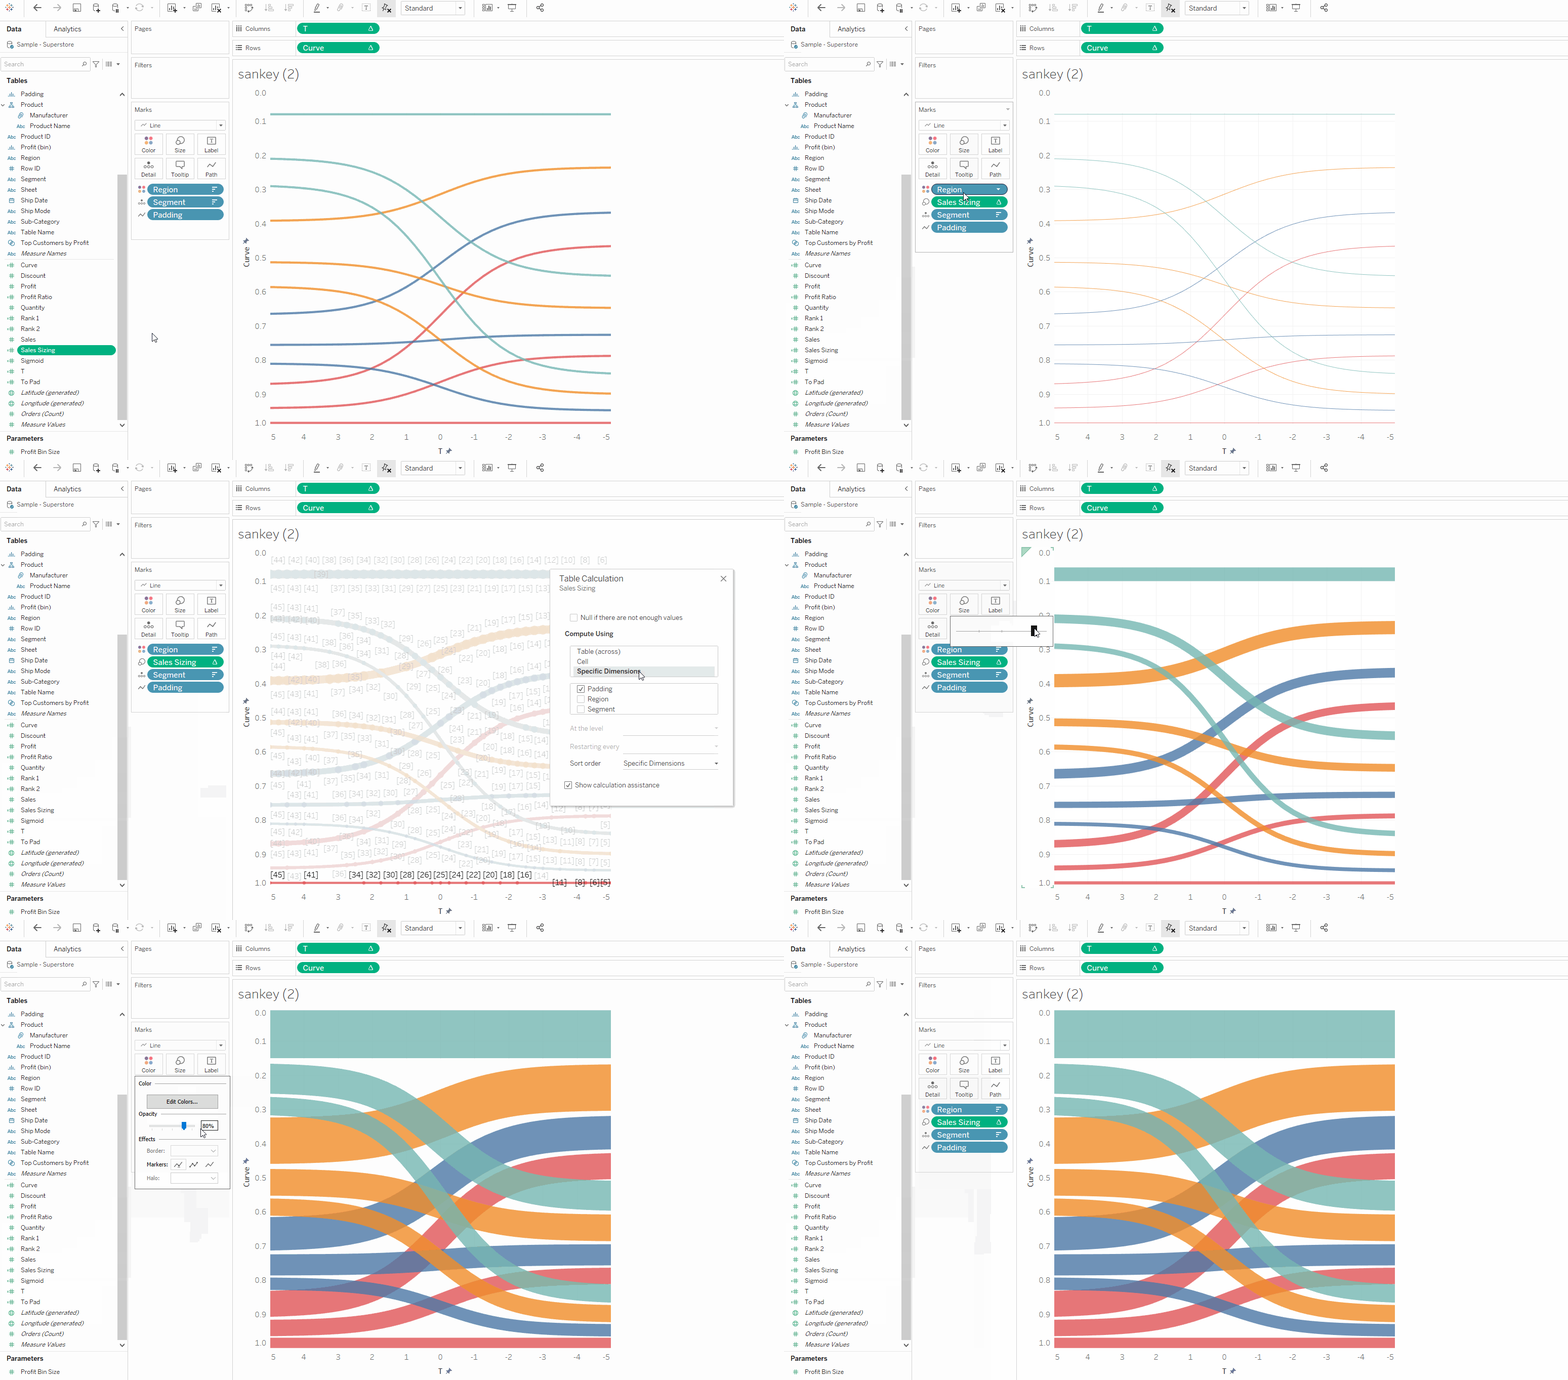
4. Put every sheet together and highlight action
Now that the sankey is done, the % of total sales in Region and Segment are also done. It is time to put all the sheet together into 1 dashboard.
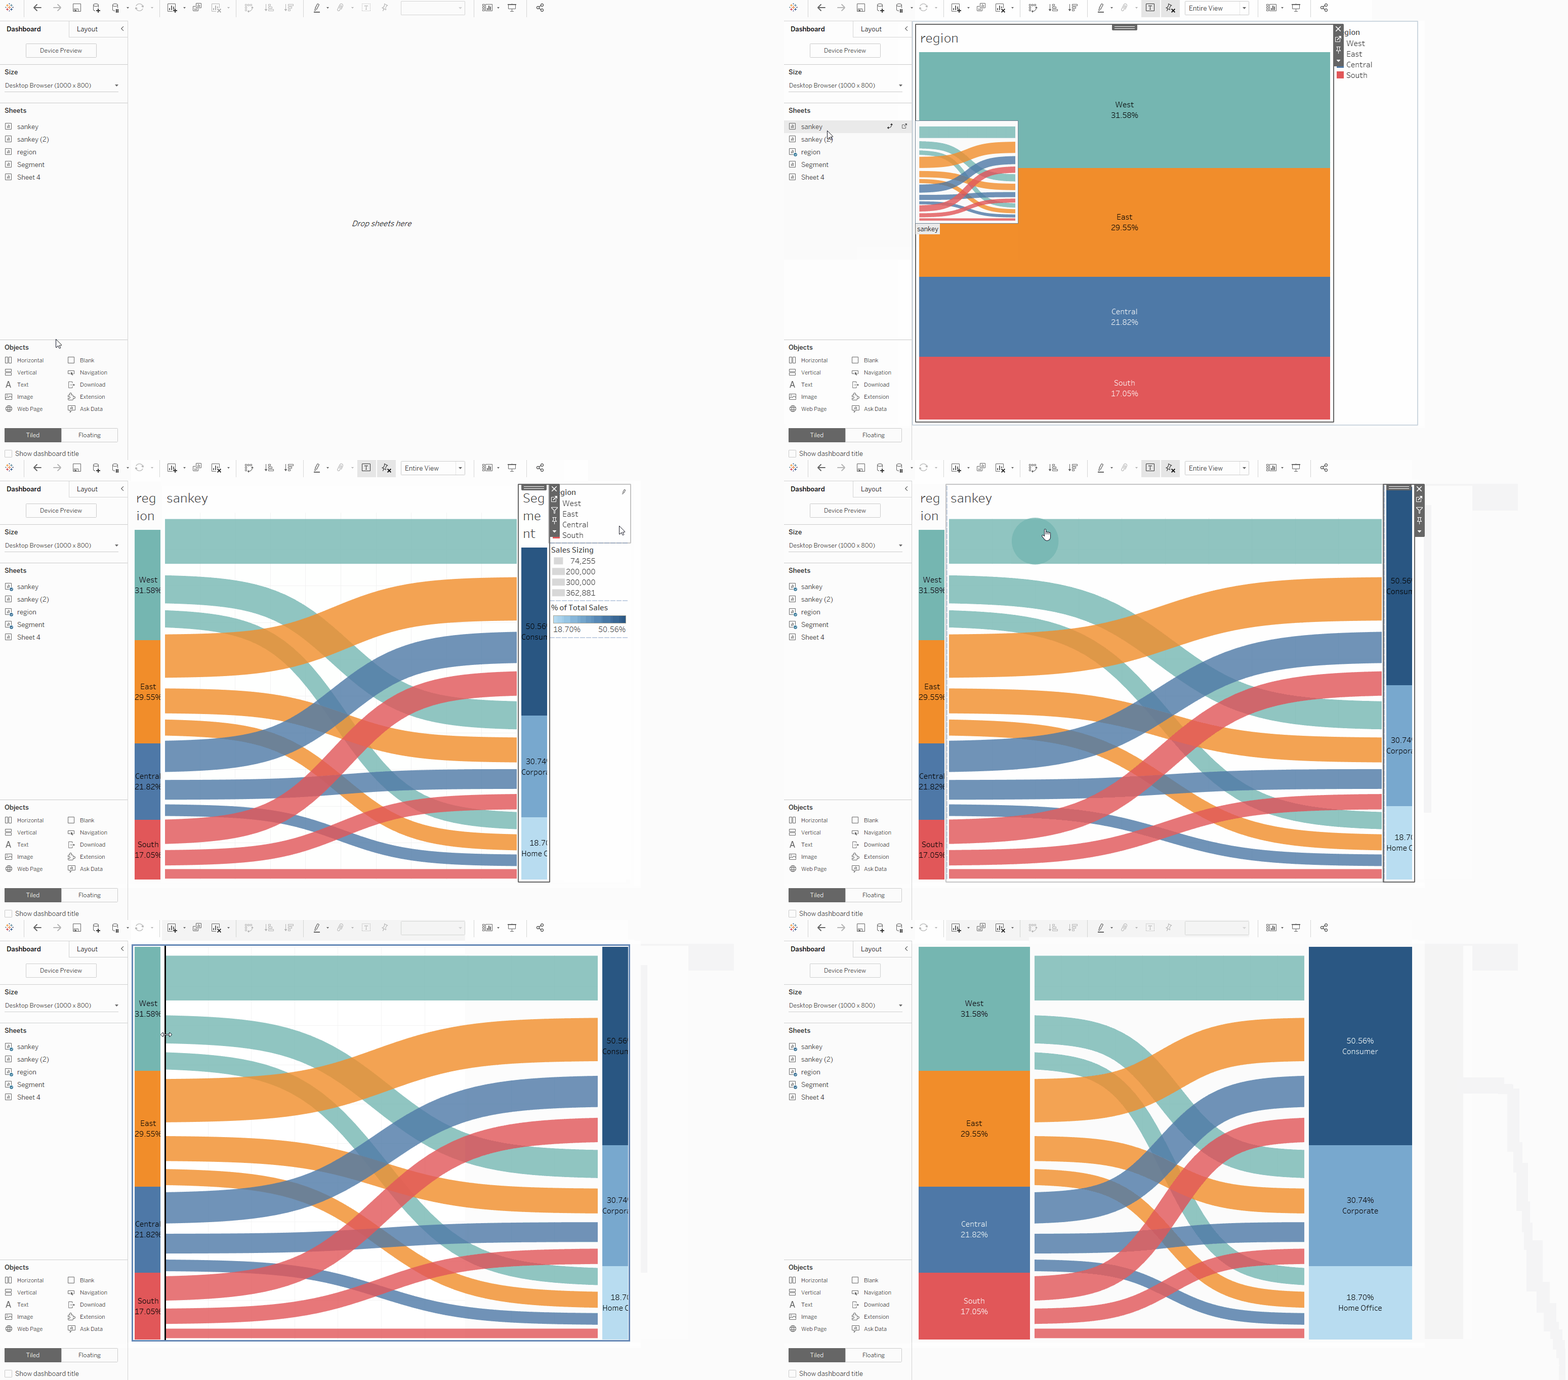
Few things to check
- Hide the sheet title
- show the headers for the sankey (right click on the axis and uncheck the "Show Header" option")
- make sure the stacked bar size is full

Last but not least, the highlight action. Configure as below:

Now you have a nice simple yet powerful sankey chart with you. Hope you find it useful and hope this is not to daunting and difficult to follow along:)
