In week 1 we were introduced to Tableau Prep Builder. The 3 areas of focus included, Cleaning Data, Joining Data and Pivoting Data.
We were given a dataset that we had to organise and prepare for visual analysis.
I started off by creating a plan for my dataset 'Monthly Sales by Year and Store':
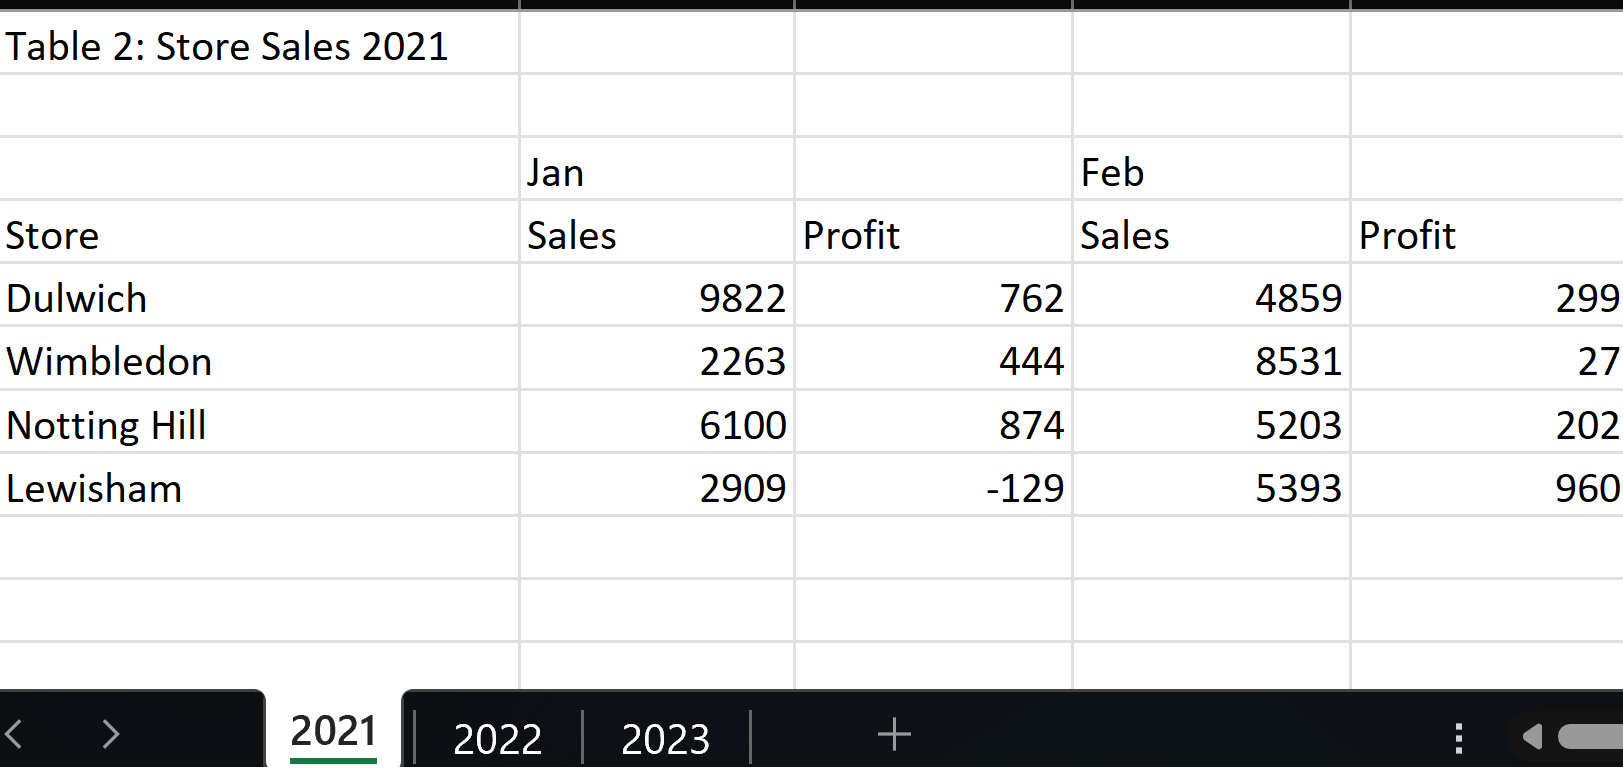
As you can see my dataset consisted of 3 different sheets labeled as the year that data was recorded. Each sheets layout was the same.
Firstly I started off by planning how I wanted my dataset to look like before jumping onto Tableau Prep.
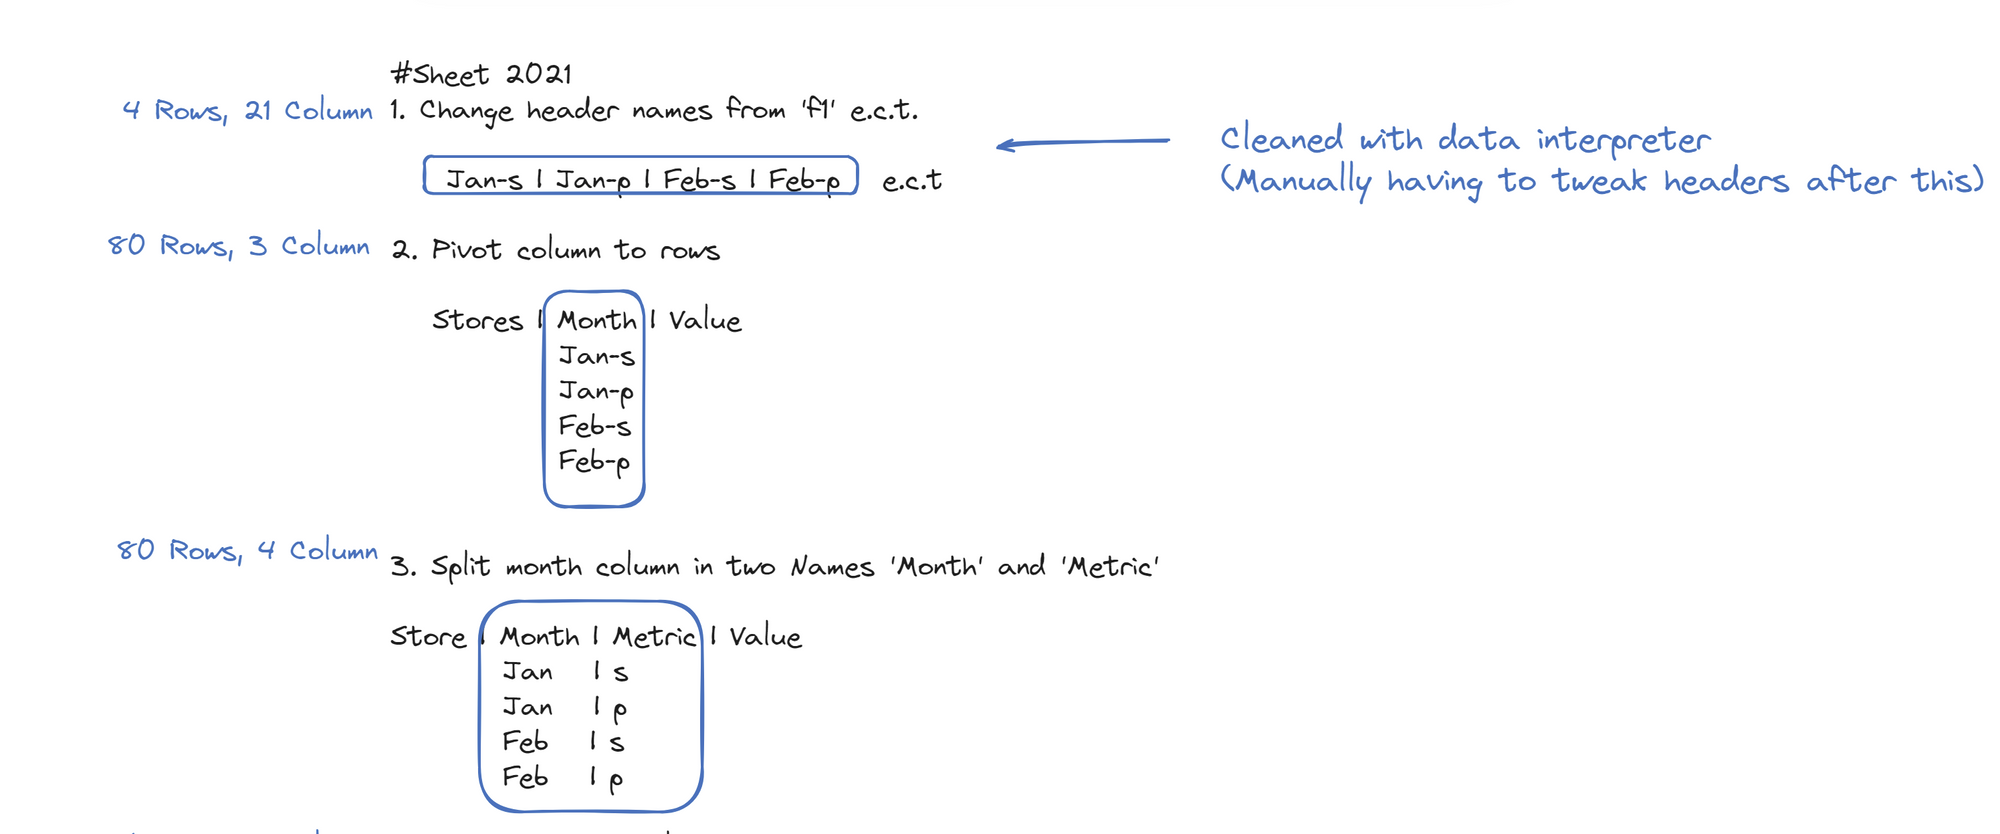
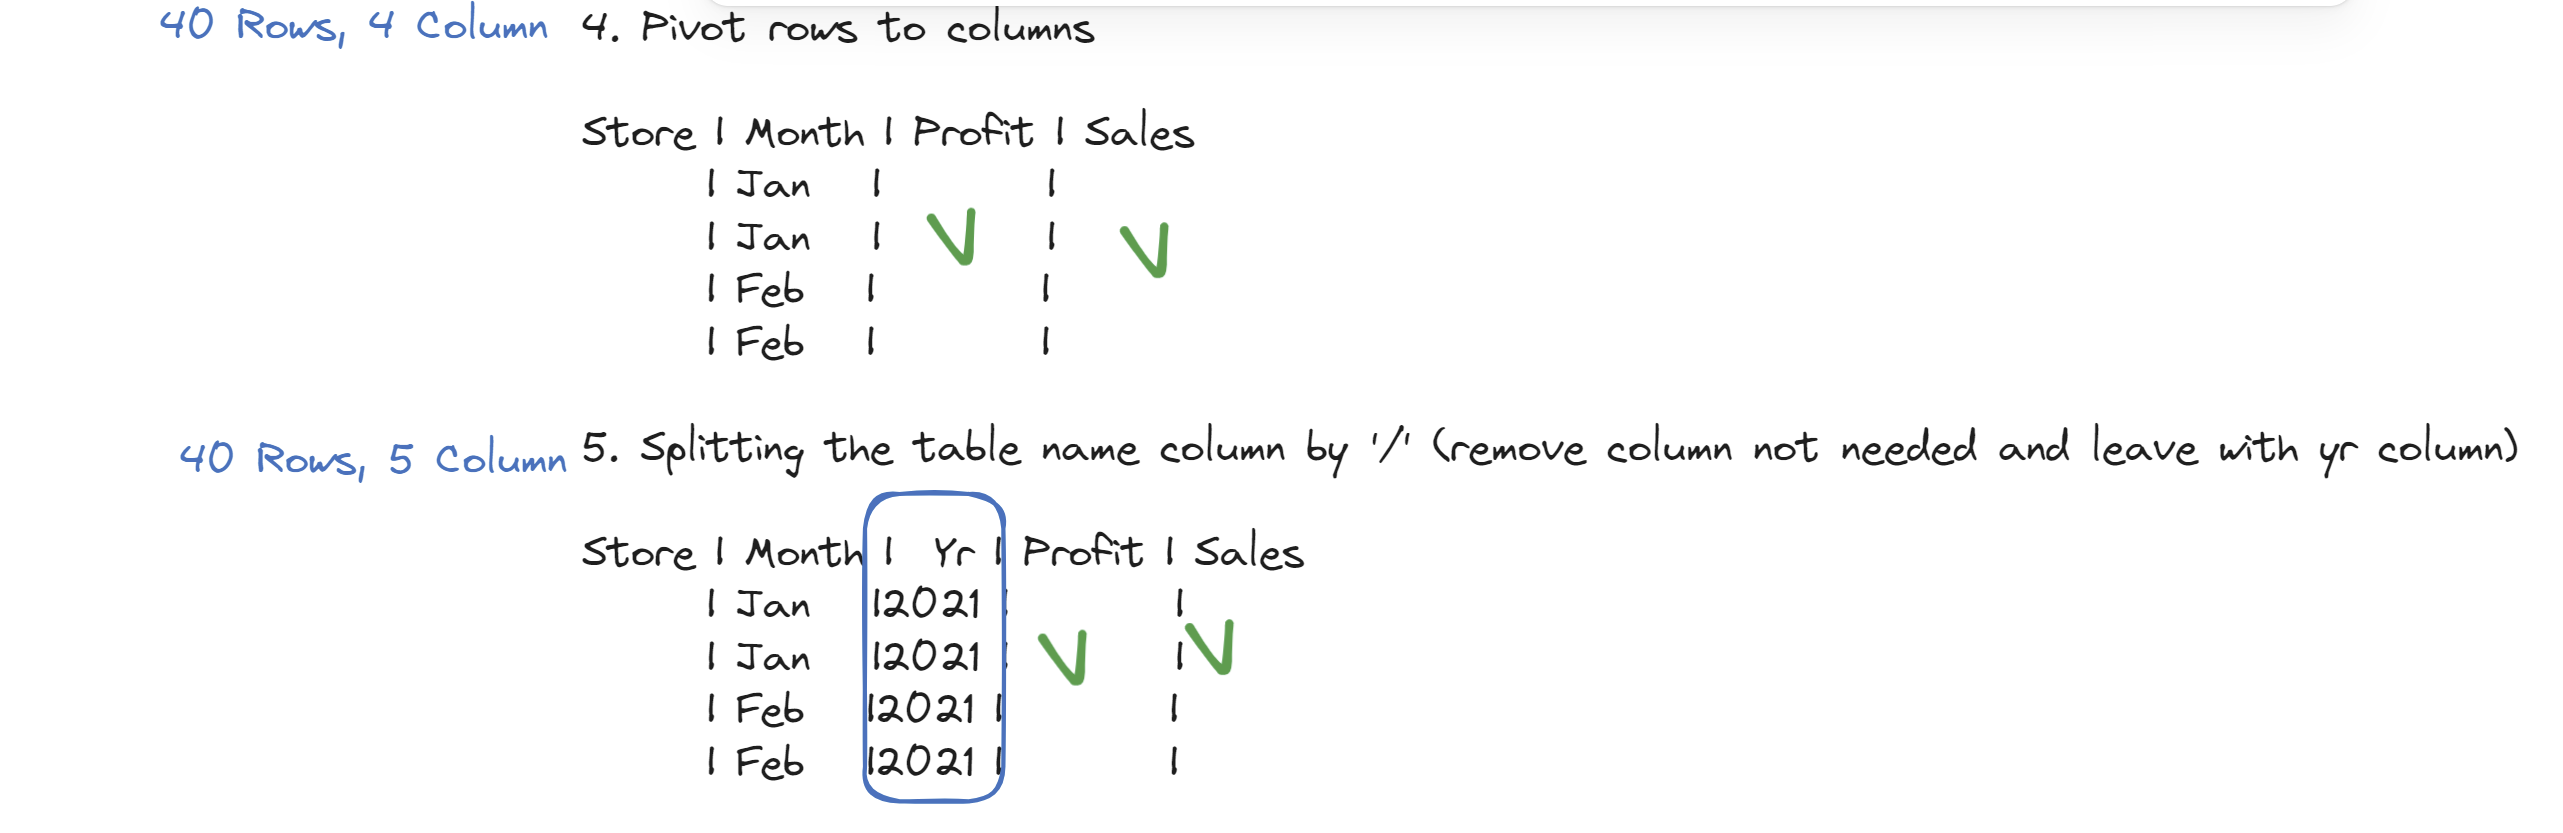
The next steps cover a pivot again however, this time we are pivoting the other way - Rows into Columns (see my previous blog on the difference).
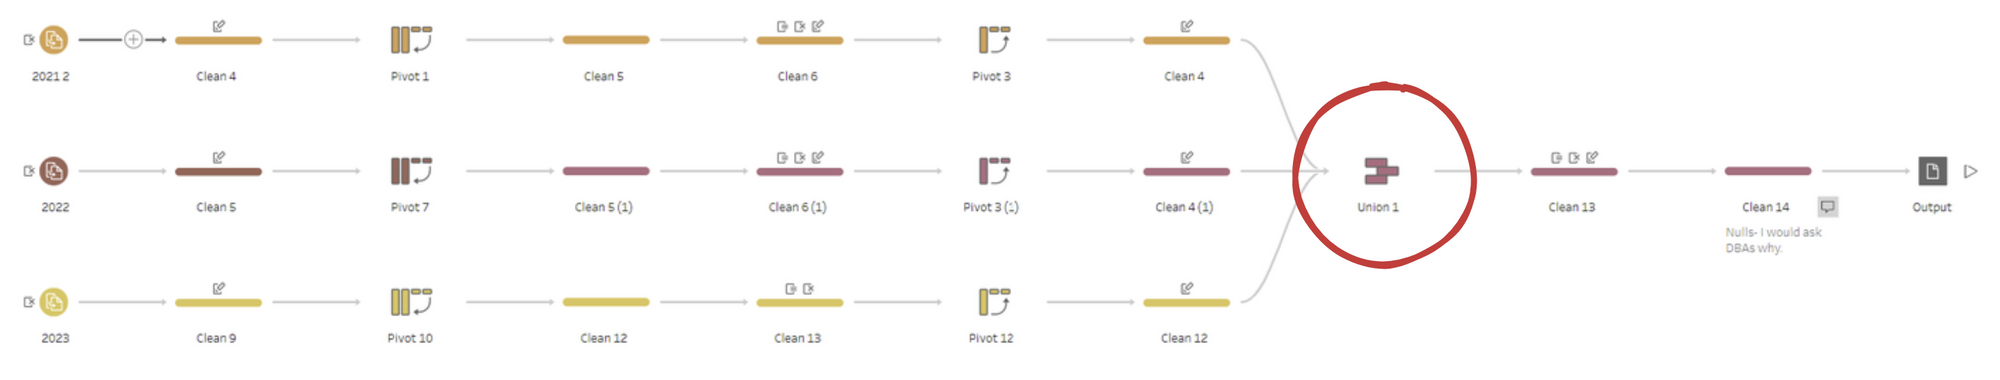
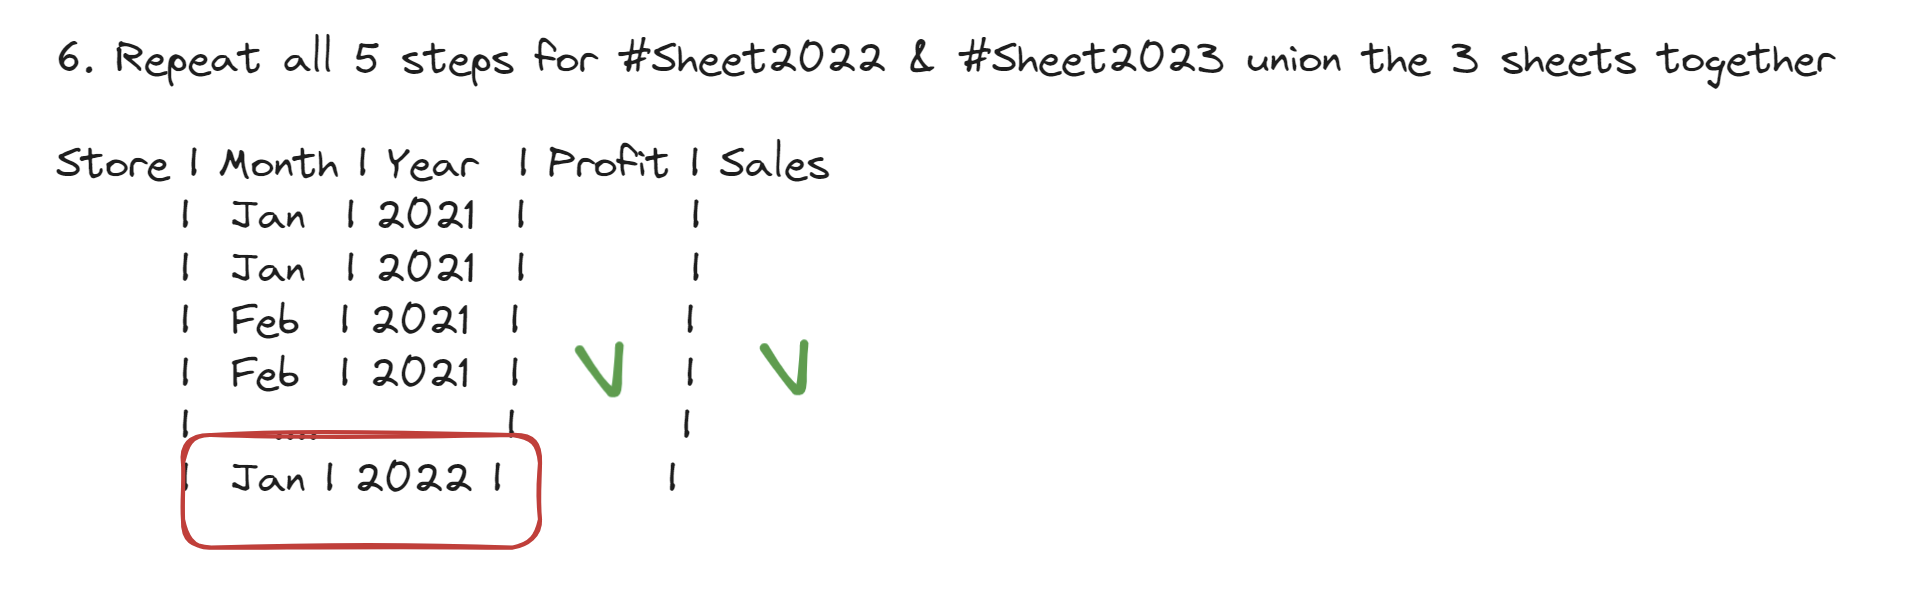
Finally I knew I needed to combine all 3 dataset together and I could do this using a Union Tool.
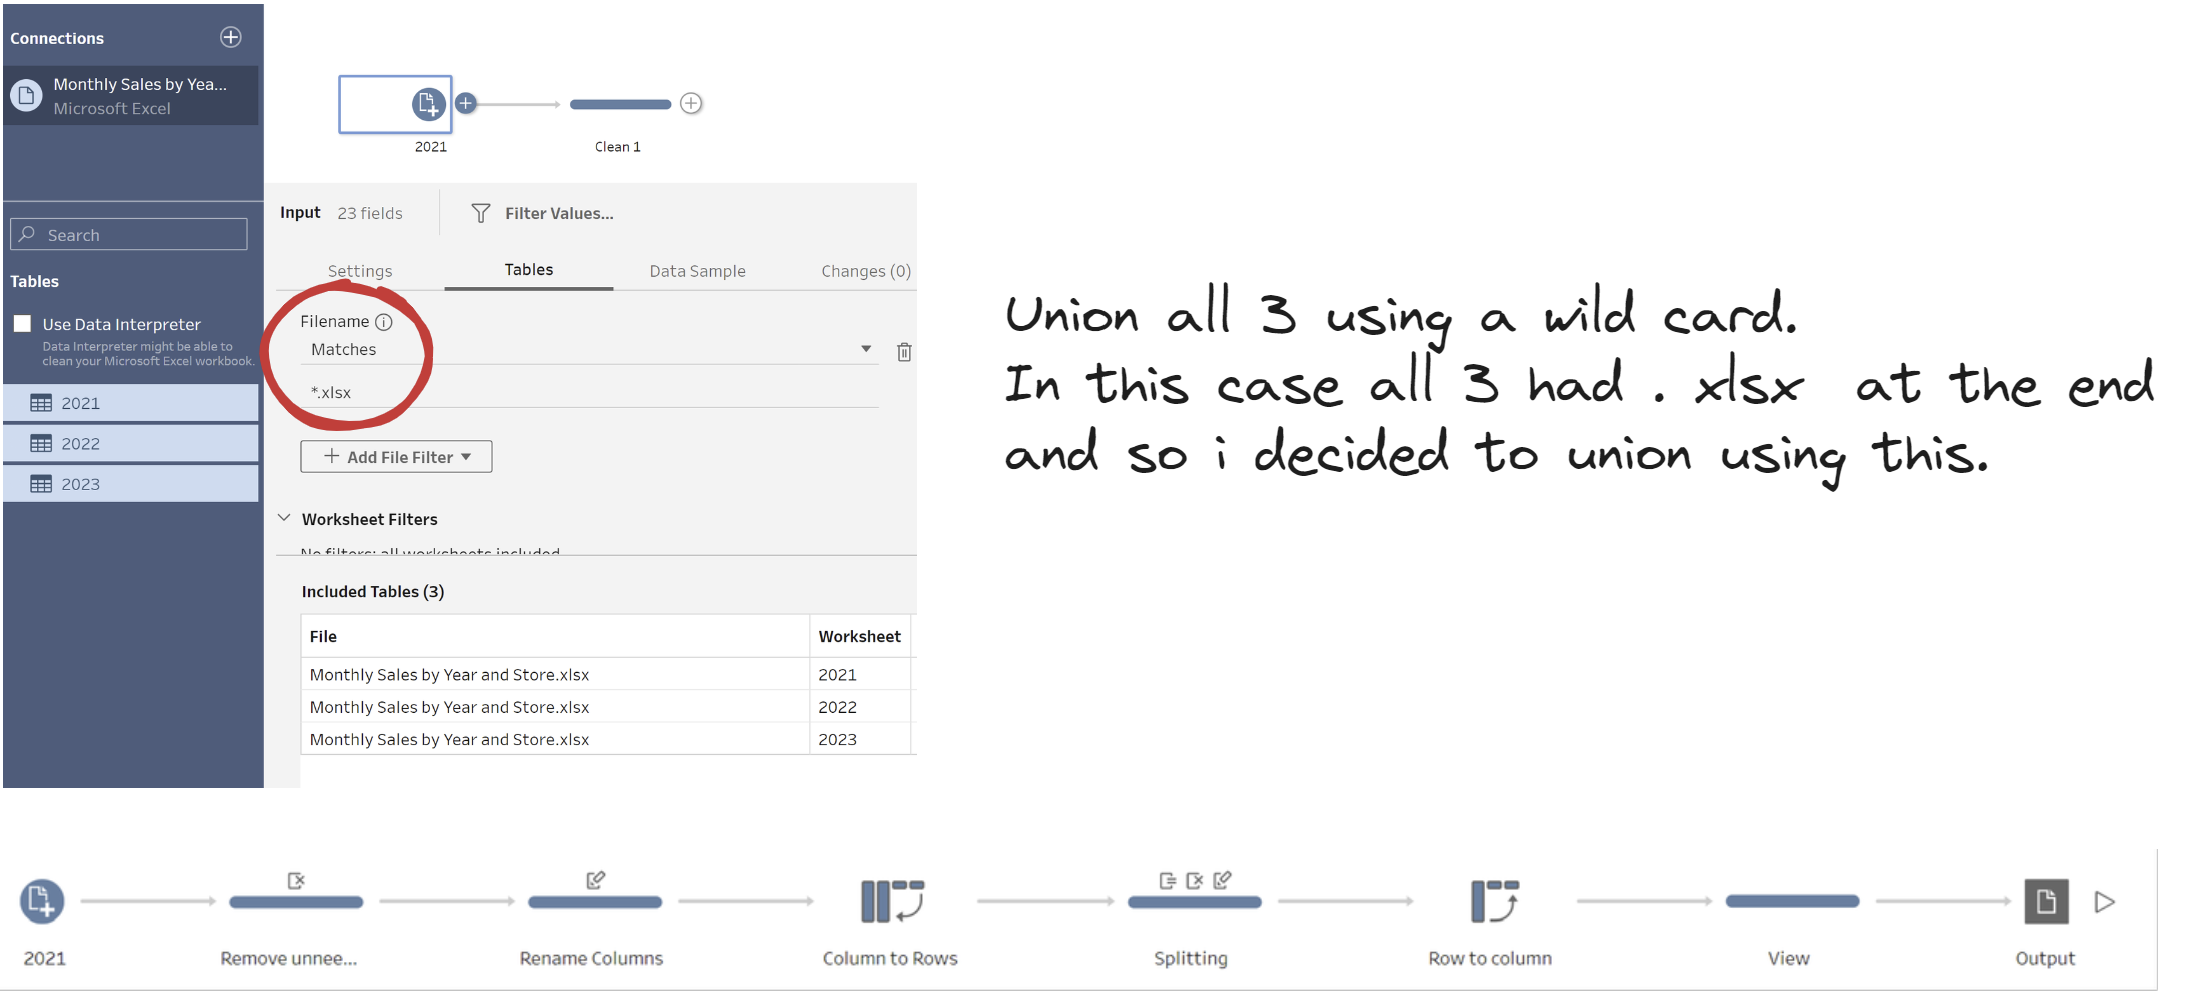
Feedback- After presenting my plan alongside my tableau prep, I was given helpful feedback regarding my prep workflow. Instead of repeating all 5 steps for sheet 2022 & 23, I should have used a wild card union at the start of my workflow. See original workflow vs workflow after feedback given.