


Day 3 we focused on the theory of pivoting your data. Essentially there are two ways in which your data can be pivoted.
Key observational takeaway- Know your data (KYD). First sketch out the dataset and identify your categories and measures. Next, sketch out what you need by identifying the data fields, their data types and the values.
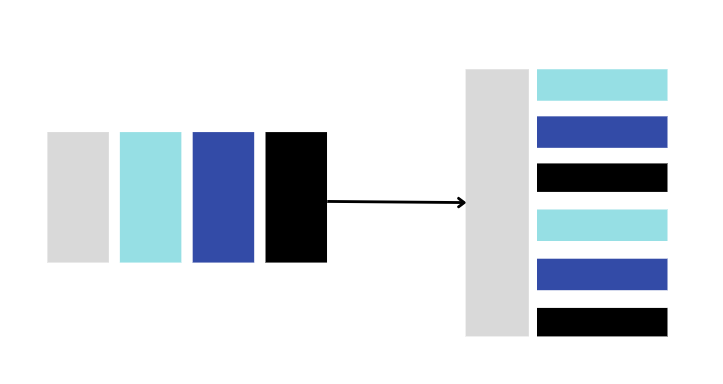
1. Columns to Rows
When pivoting columns into rows, you are taking columns that represent the same measure and converting them into a single row. This will stack the values. There will also be a key column of your choice (light grey) that will remain.
Essentially, the dataset will pivot from a wide view into a narrow one.
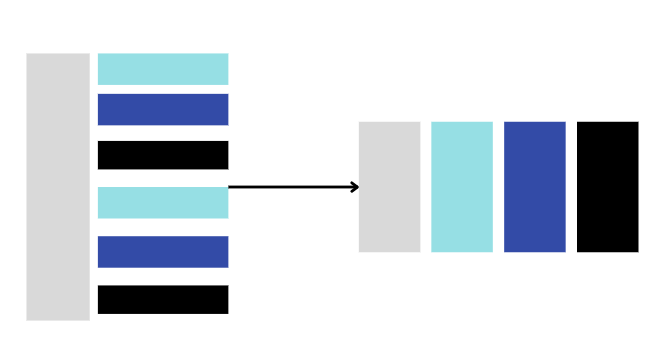
2. Rows to Columns
When pivoting rows into columns, you have multiple measures in the same column that you want converted into their own column. This can lead to multiple values gathering in one cell so it's important to know how you want your values, that being either aggregated or concatenated.
Essentially, the dataset will pivot from a narrow view into a wider one.
Tomorrow we will be jumping into Tableau Prep, learning the basics, while also applying the theory we covered today.