


Drill-down
Enables users to explore data at different levels of granularity.

Up wards arrow - Drill up
Downwards arrow - Drill Mode is on: Click a data point to drill down
Two downwards arrows - Go to the next level in the hierarchy
Fork arrows - Expand all down one level in the hierarchy
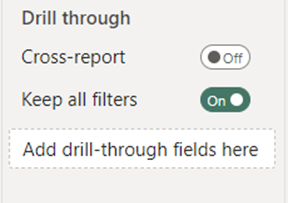
Drill-through
Allows users to navigate from one report to another, usually from a summary report to a detailed report, for deeper insights.
Here are the steps for this to be achieved:
- Insert > Shape on to the page you want to drill through from. (In the image this is 'Sales Exercise' )
- Go to the page you want the drill-through to (Sales Breakdown). In the visualization pane at the bottom right, add the fields you want to drill through on. (For the instance of the image above, State/Province and Category have been selected for drill-through).
- Now it's time to add and action 'drill-thorough' to your shape. Switch back to the drill-through from page (example- Sales Exercise).
- Select shape > Format > Action > Type : Drill through > Destination : Page you want to drill-through to (in this case Sales Breakdown).
Making your text dynamic
Steps to create the ' Category' Label in the image above:
- Create a measure:
Selected Category = SELECTEDVALUE(Orders[Category],"All Categories")
- Text Box> +Value > 'insert measure' (Selected Category) > Save
This exercise used the Sample Store Dataset.