Web scraping + APIs Challenge
Its time for a drink!!
- Scrape the website: The Cocktail DB - Using Alteryx
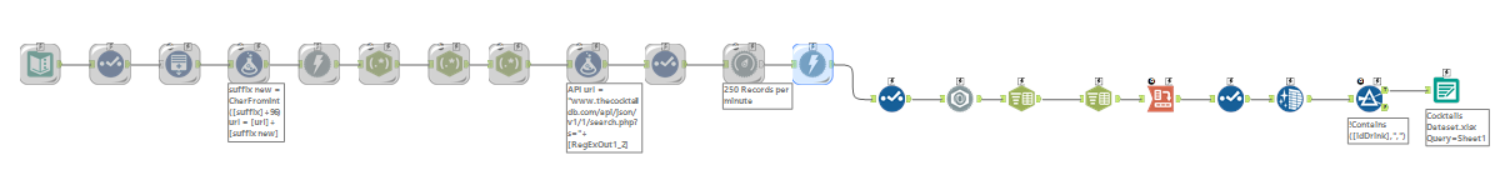
- !Important! Make sure to cache and run on your download tool.
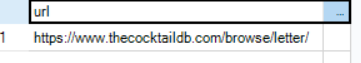
- First step was to take the url of the site we are web scraping.
- Where the end of the url is blank (after the last forward slash) I wanted to add each letter that the cocktail starts with, but instead of replacing I wanted to have multiple rows with the different letter so I could bring them all in at once. This was achieved by using the Generate Row Tool by adding the suffix.
- Extracting the correct fields and section of the fields I used Reg.Ex, Formula, Split-to-columns and Cross Tab tools.
- The columns i was left with for my analysis:
Drink Name | Drink Category | Glass Type | Ingredients | Instructions | Measures
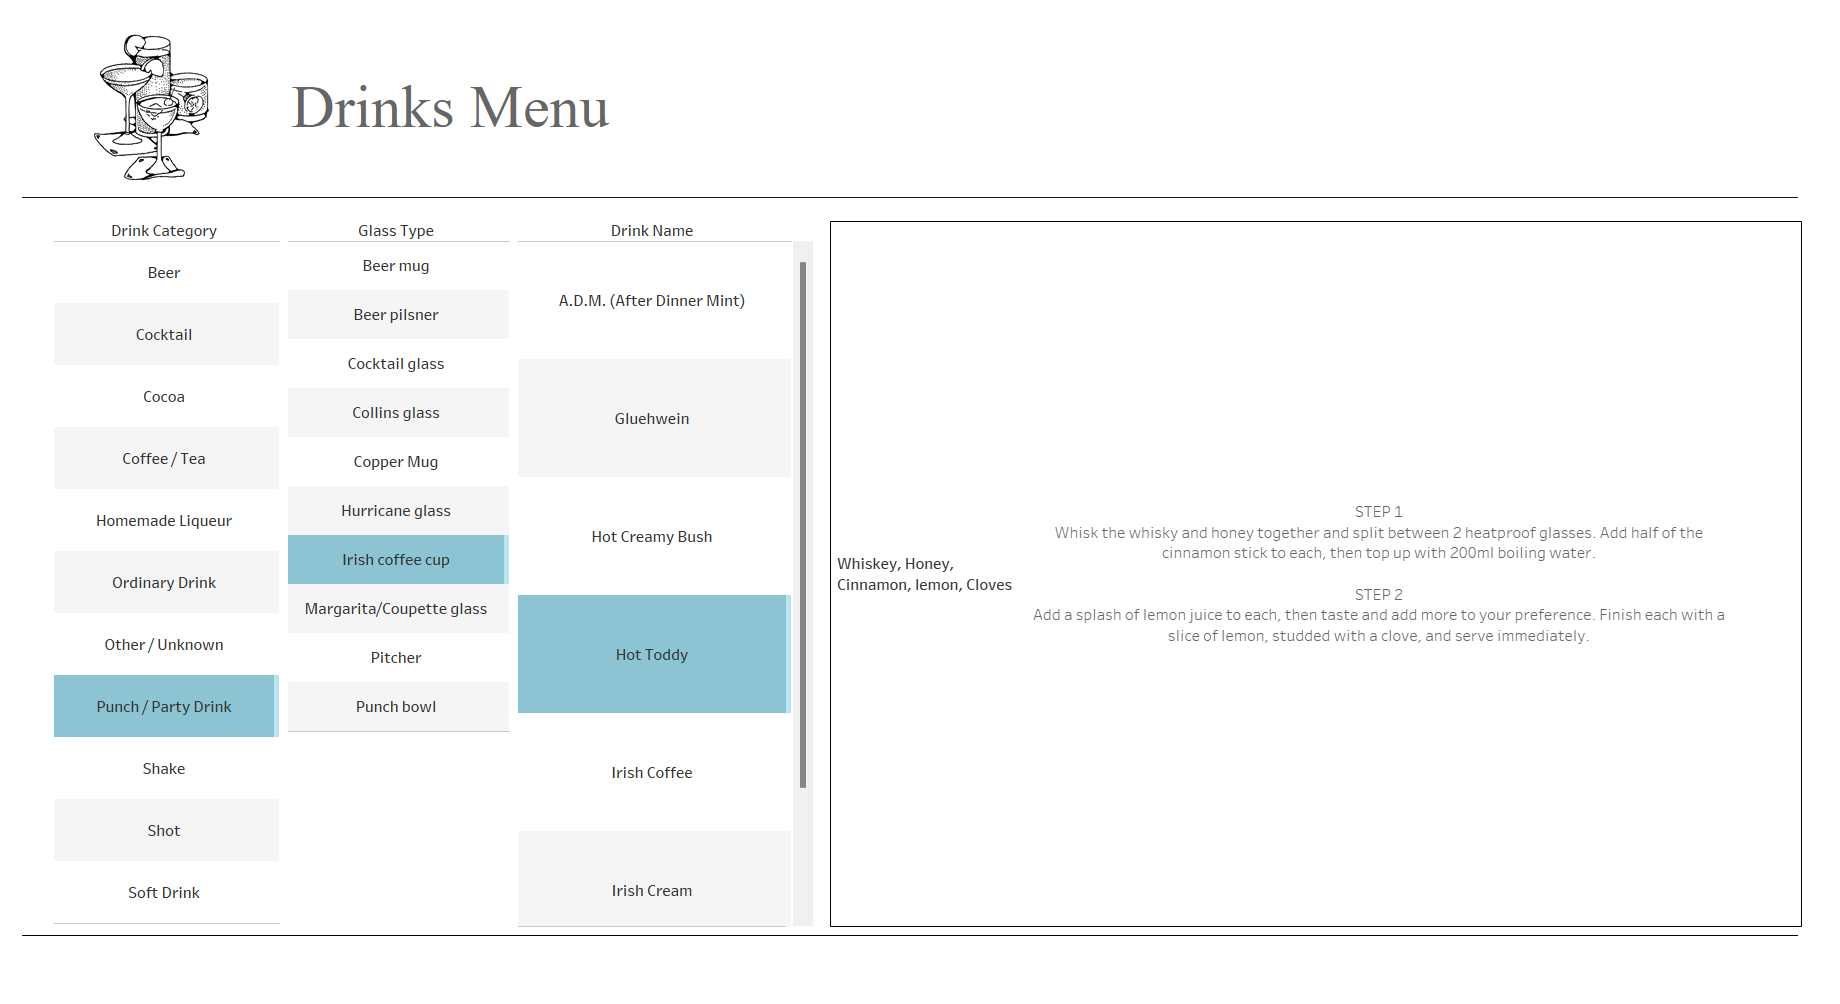
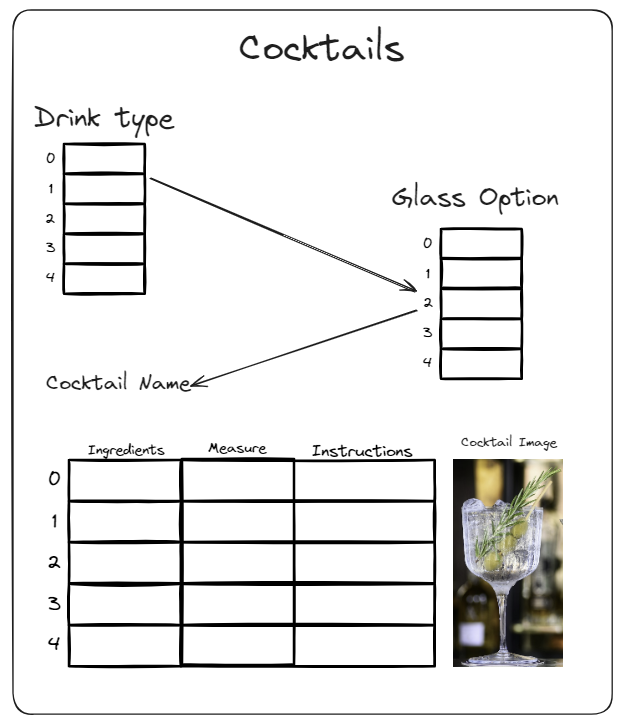
- Sketch viz
- The Idea is for the user to select from options and it will generate their cocktail instructions.
- Tableau Building Time
- For my viz, i allowed the user to select their chosen path that will generate the ingredients and instructions for their drink.
- With extra time, I would incorporate the image of the cocktail onto the dashboard. With this I would also Include the measurements for each individual ingredient. Finally I would allow for the user to chose between Alcoholic and Non-Alcoholic drinks.