


Day 2 & 3 we were set with the task of creating a visualisation using IMDb dataset.
#dataplusmovies
First step...PLAN!
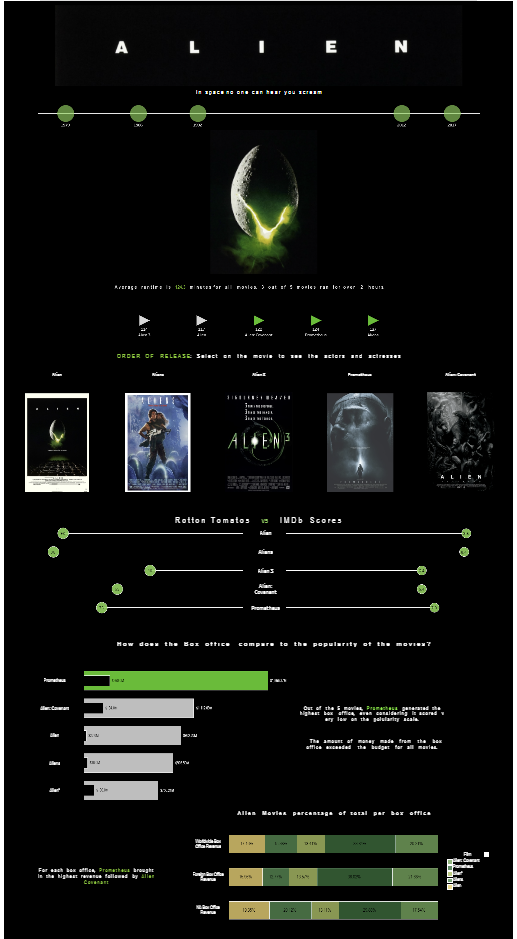
- I started off by taking a look at the data and deciding what story I would like to tell. In my case i chose to take a deep dive into the world of the Alien Franchise.
- After deciding which fields I wanted to use in my analysis I focused on my sketch: This was my original thought process for my visualisation.

- Next I needed to gather additional data as some of my ideas for analysis didn't have these fields in the original dataset. For this I needed to web scrape. Using Google sheets I extracted Box Office and Rotten Tomatoes data. Using the hand function: =IMPORTHTML("URL", "query", "index")
- I decided to use Alteryx for my data preparation in order to join on additional datasets and clean up existing columns.
- Once my data was sorted, it was time to start building on Tableau!
As you can see during the building of my viz, i decided to change a view of the charts. With further time I would have like to incorporate a radial chart showing the runtime for each movie and a further analysis that focuses on the lead characters.