It's all about LEGO!!!
Today's challenge...
- Query the data through Snowflake SQL
- Build analysis through Power BI
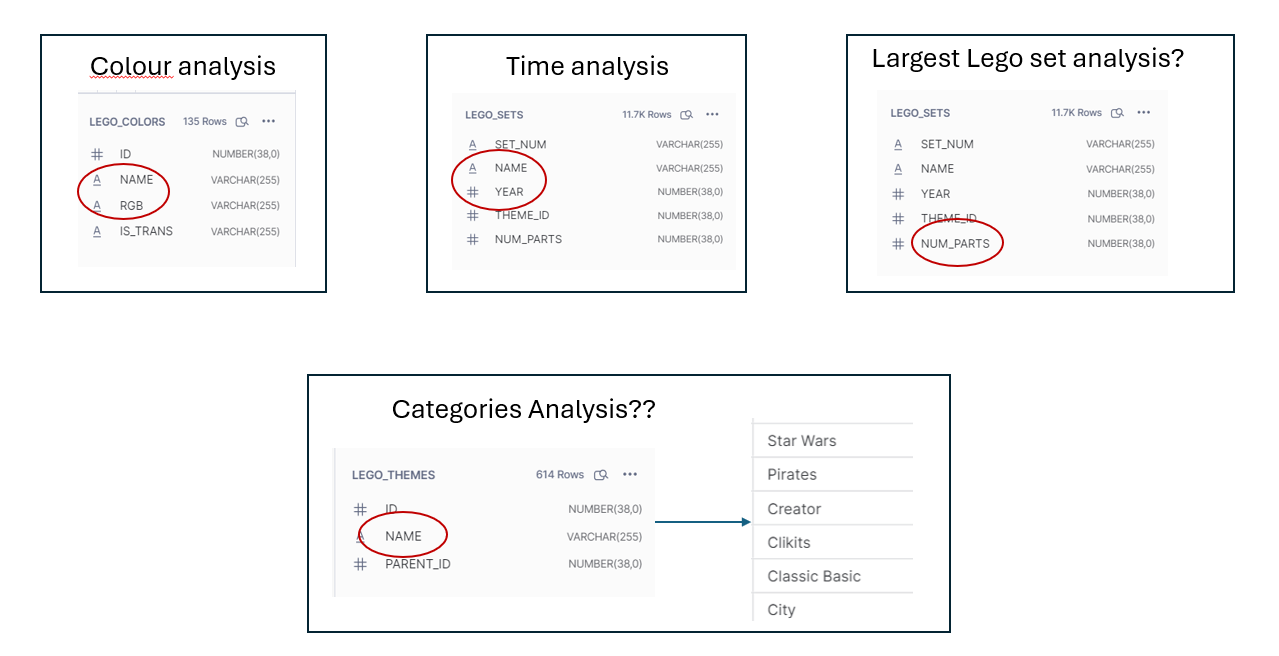
BRAINSTORMING: First step was to plan what analysis I wanted to build. By looking through the different (un-joined tables) I was able to identify certain fields I wanted analyse.
DATA PREPERATION: Lets jump onto Snowflake. After deciding which fields I wanted to investigate, my next challenge was to join these tables together. I wanted the most out of my dataset, so I have included all fields using the asterisk function (*). Although this is useful when you aren't so familiar with your dataset, it does mean you'll end up withy duplicated fields when using joins.
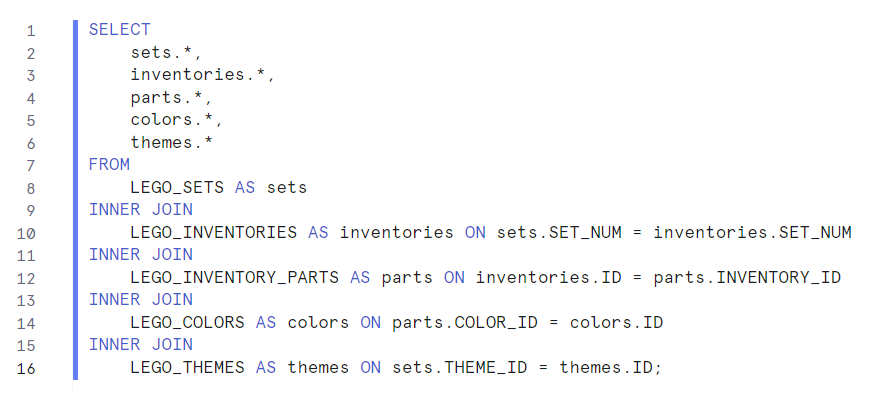
Essentially, all columns from the tables LEGO_SETS, LEGO_INVENTORIES, LEGO_INVENTORY_PARTS, LEGO_COLORS, and LEGO_THEMES have selected and brought in through joins.
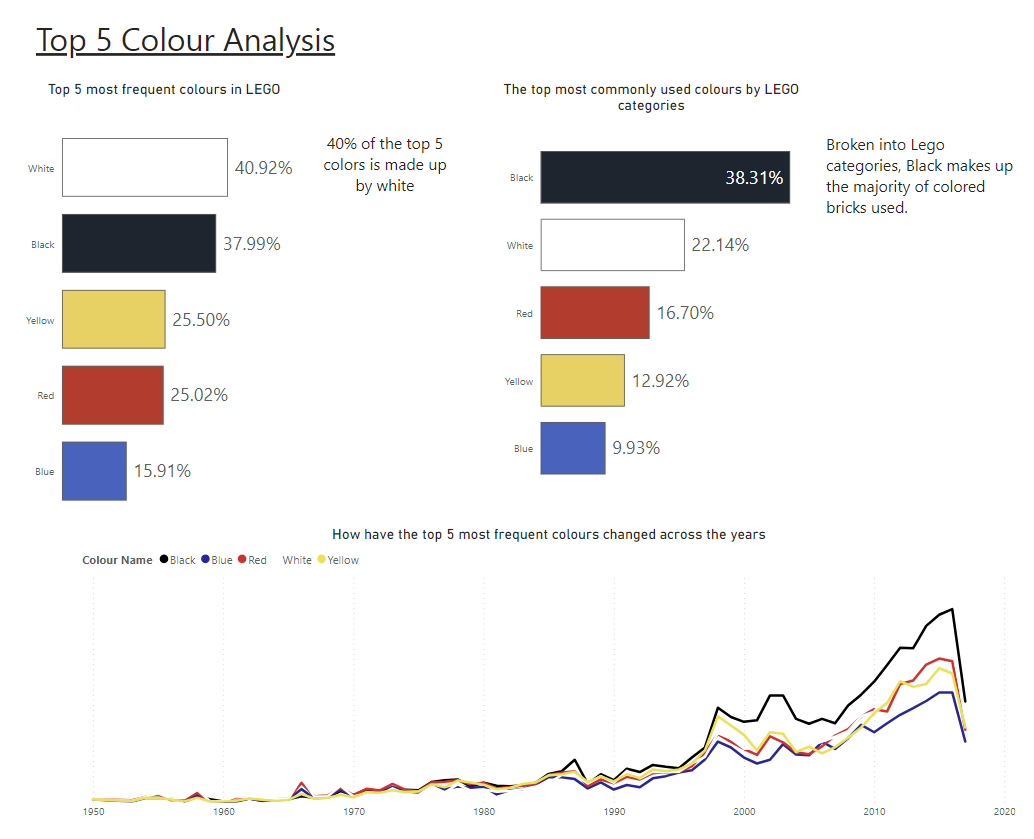
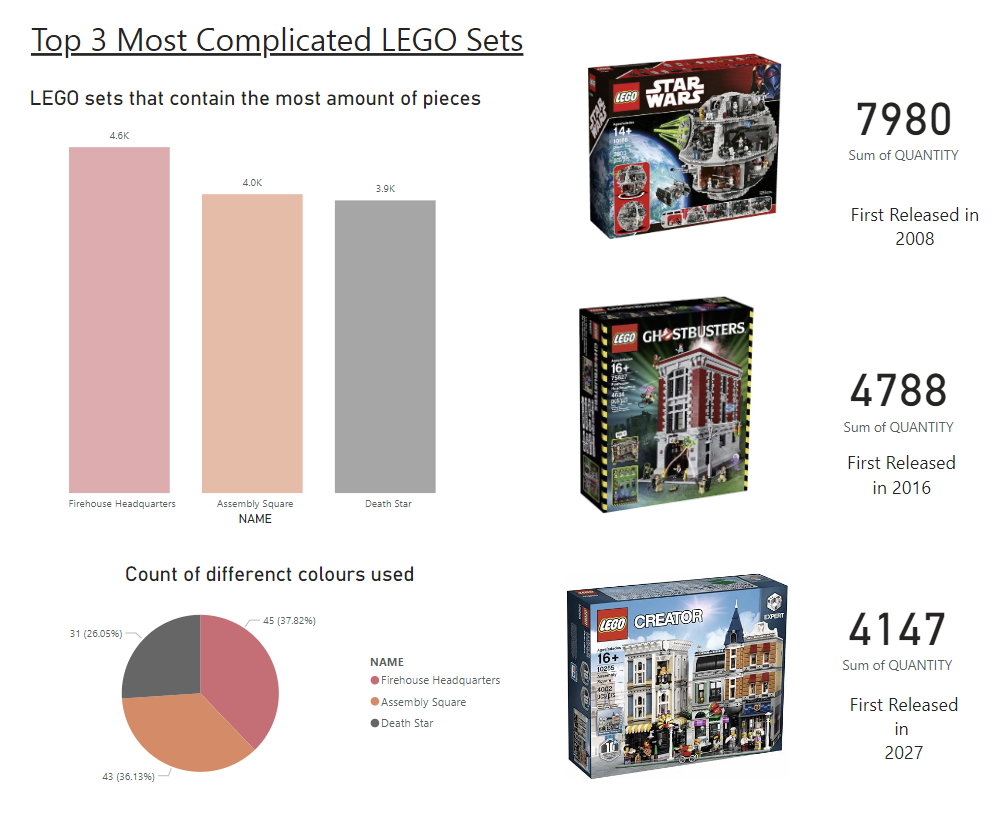
ANALYSIS: It's Dashboard building time!!
This challenge was under time constraints, therefore my analysis was only able to stretch so far as the majority was understanding my dataset. See below my finished Dashboards.