


A parameter in Power BI is a named value or set of values that can be referenced in expressions, queries, filters, and various calculations within the Power BI Desktop. This feature allows for the user to explore and customize the analysis of the report by selecting the different measures or dimensions they're interested in.
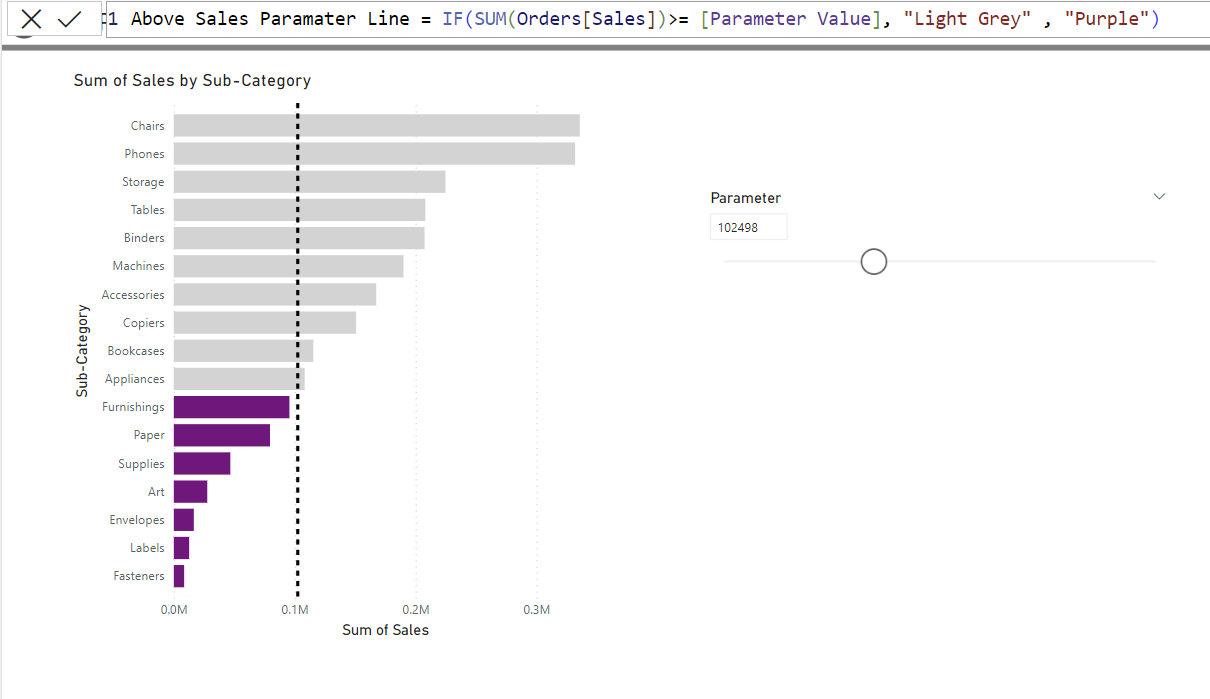
Use Case: Referencing sale values to target values:
Creating Parameters:
- Modeling tab > Parameters > Numeric Field (image above use this option) or Fields> Select your range for the Parameter slider> Create
- The Parameter box should appear on your canvas.
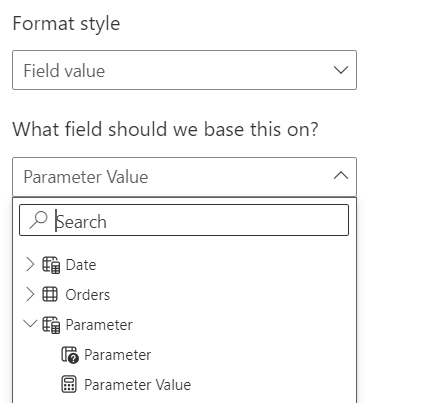
- Adding the parameter to your chart... Select Chart > Visualization pane and select Analytics > Constant Line 'Add' > Line > 'fx' Function > Format Style 'Field Value'> Field based on 'Parameter you just created' > OK
For further analysis see my previous blog on : Colouring Bars Using DAX
https://www.thedataschool.co.uk/alexandra-skelly/colouring-bars-using-dax-in-power-bi/