Continuous and Discrete Dates in Tableau Desktop
Dates are one of the most common fields in Tableau and will appear in the majority of projects you take on in your Tableau journey.
Though using dates on a dashboard may sound simple enough, there are some things that need to be considered. Depending on how you use it, the same date field can yield very different results in a visualisation. The reason for this is the difference between continuous and discrete dates.
The easiest way to distinguish the two is to look at the color of their pills: blue pills and green pills.
Discrete Time
Discrete time will appear on your shelf as a Blue Pill.

Tableau treats discrete date values as a set of individual categories. Instead of creating a single continuous scale, Tableau creates a separate header for every value. For example: January, February, March.
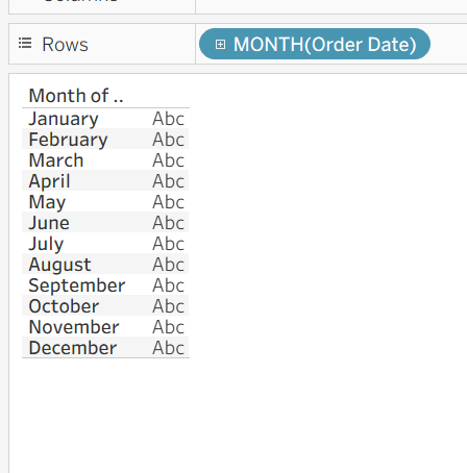
An important takeaway here is that each date is not treated as part of a single timeline. January is its own category, as is February, and so on. Discrete dates allow you to reorganise these date parts, something not possible with continuous dates.
This allows you to do the following:
- Break chronology
- Apply custom sorting
- Rearrange placement
Continuous Time
Continuous time appears on your shelf as a

Unlike discrete dates, continuous dates treat time as a continuous trend across a horizontal or vertical axis. Continuous time in Tableau plots every date sequentially in chronological order, rather than as individual categories.
For example, plotting 4 years of monthly data continuously generates a smooth, chronological 48-month timeline.
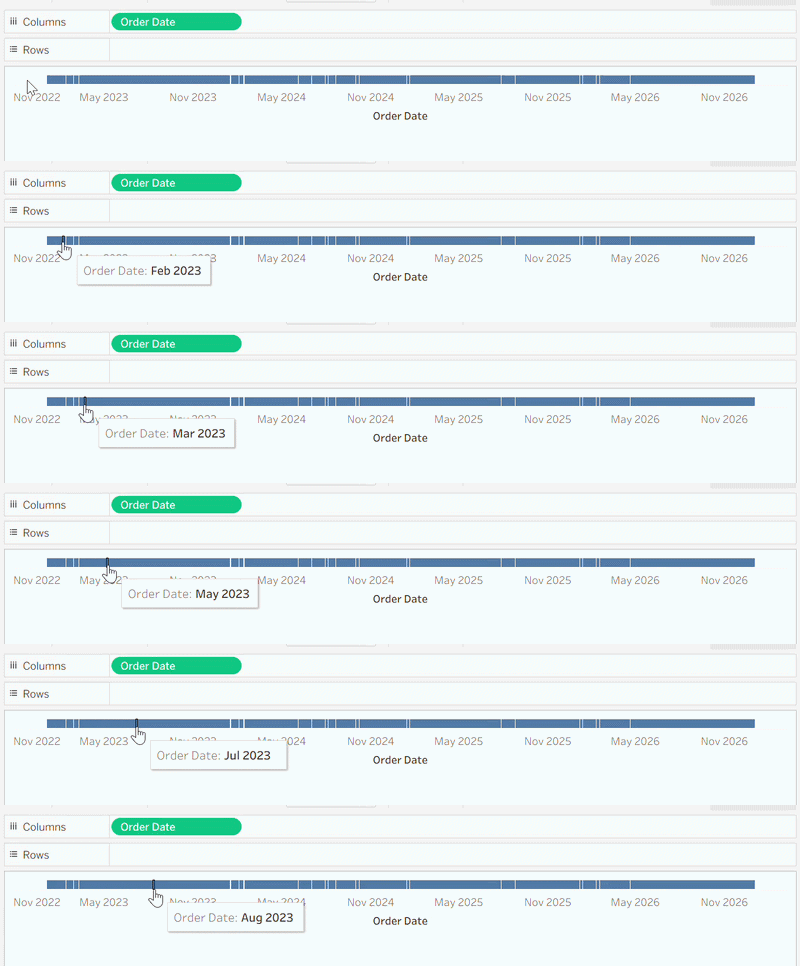
Continuous dates allow you to:
- View true overall trends.
- Maintain chronological order.
- Connect data points to see growth, dips, and direction over time.
Discrete & Continuous Side by Side:
A good way to remember the differences is with the following table.
| Time Type | Continuous or Discrete? | Tableau Color | Visual Effect / Example |
| Date Part | Discrete | 🔵 Blue | Creates separate headers/categories (e.g. January, February, March) |
| Date Value | Continuous | 🟢 Green | Creates an unbroken axis along a timeline (e.g. Jan 2023 – Dec 2025) |
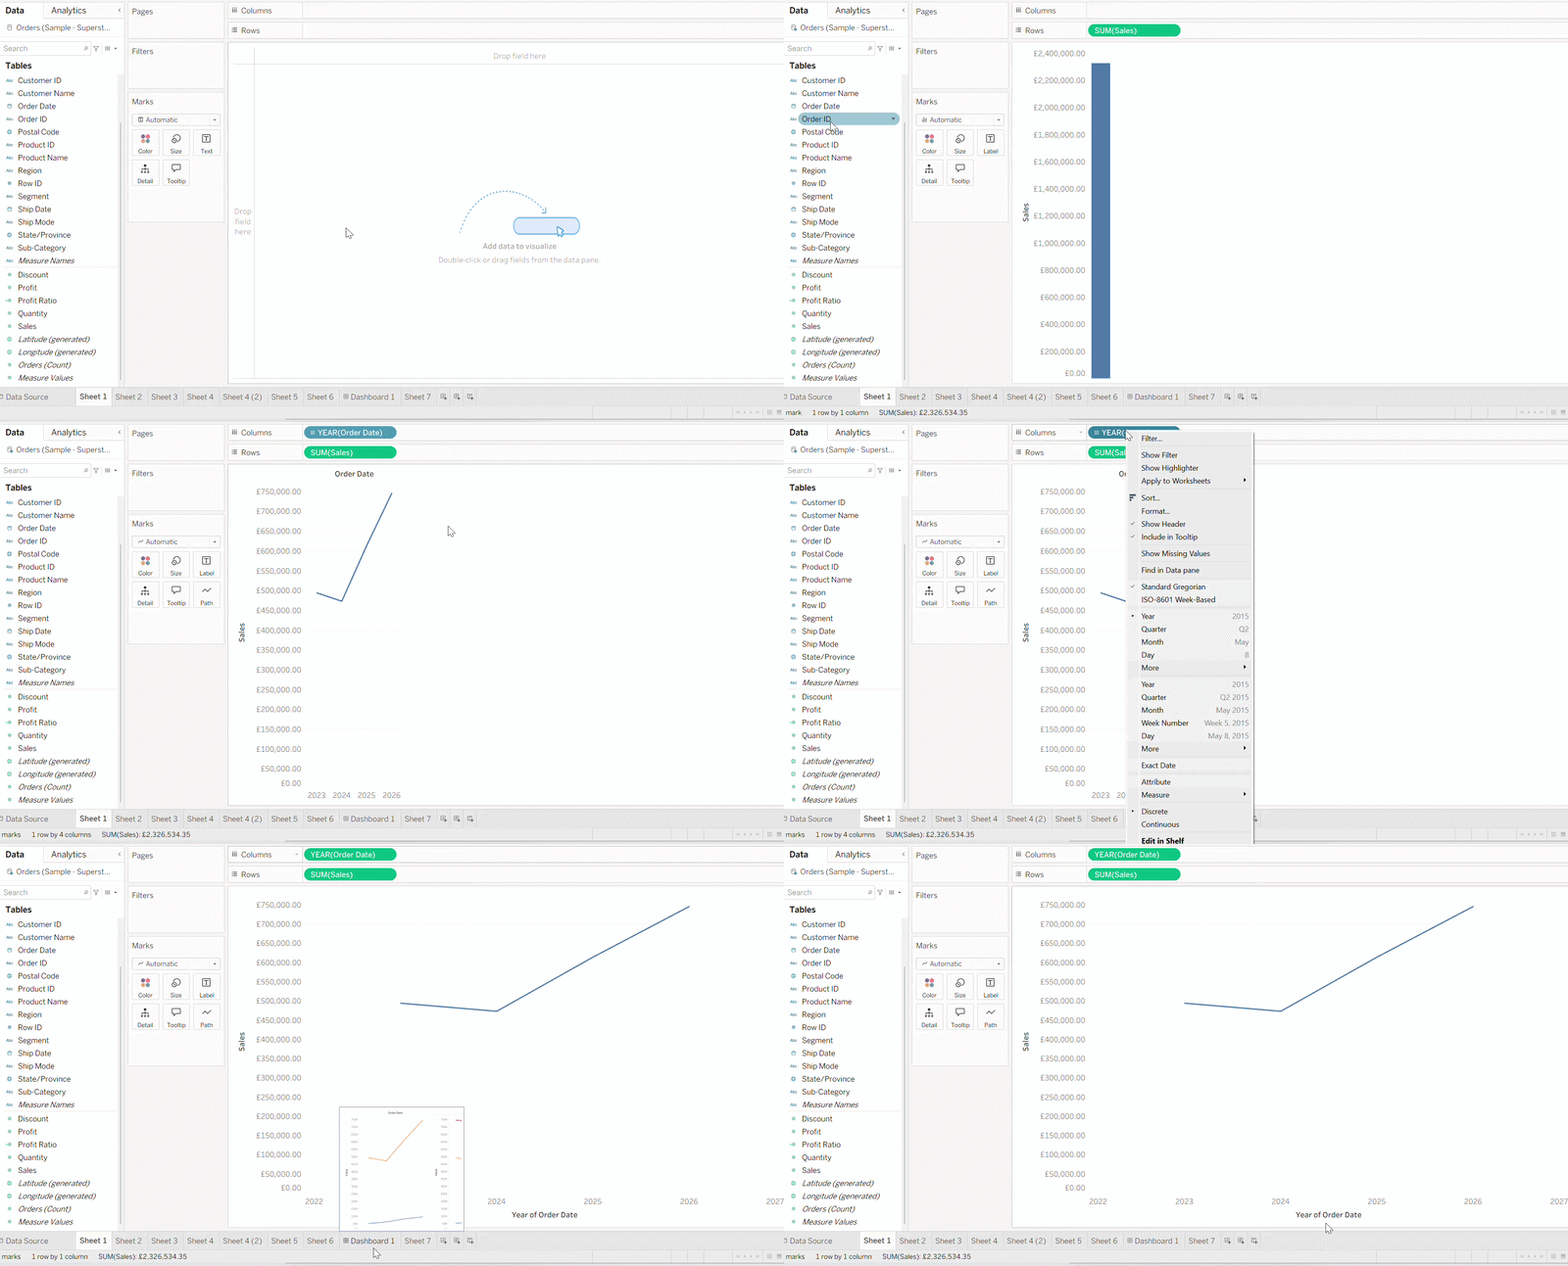
Here is an example of what it looks like to switch between Discrete and Continuous in Tableau.