


Whilst in training at the data school we take on client projects on a weekly basis. They are a great opportunity for us as trainee consultants to get real world experience of how to run and work on a project. I wanted to share the beauty of data discovery and how it can help streamline a project.
Data Discovery is a simple step but has a huge impact. Its as simple as looking through the data that you have been provided and talking and making a note of the fields you have, the values, data tyopes, time period, etc. the list goes on. This sounds like an easy step to do but it is because it seems so straight forward that it can sometimes go under the radar. One of the things I like to do when doing data discovery is to make sure that all the values I have seem sensible. For example if I have a Sales Value column, I would not expect to see any negative values. If I do see negative values I would investigate and see if they are actually returns or if there is an issue with the data.
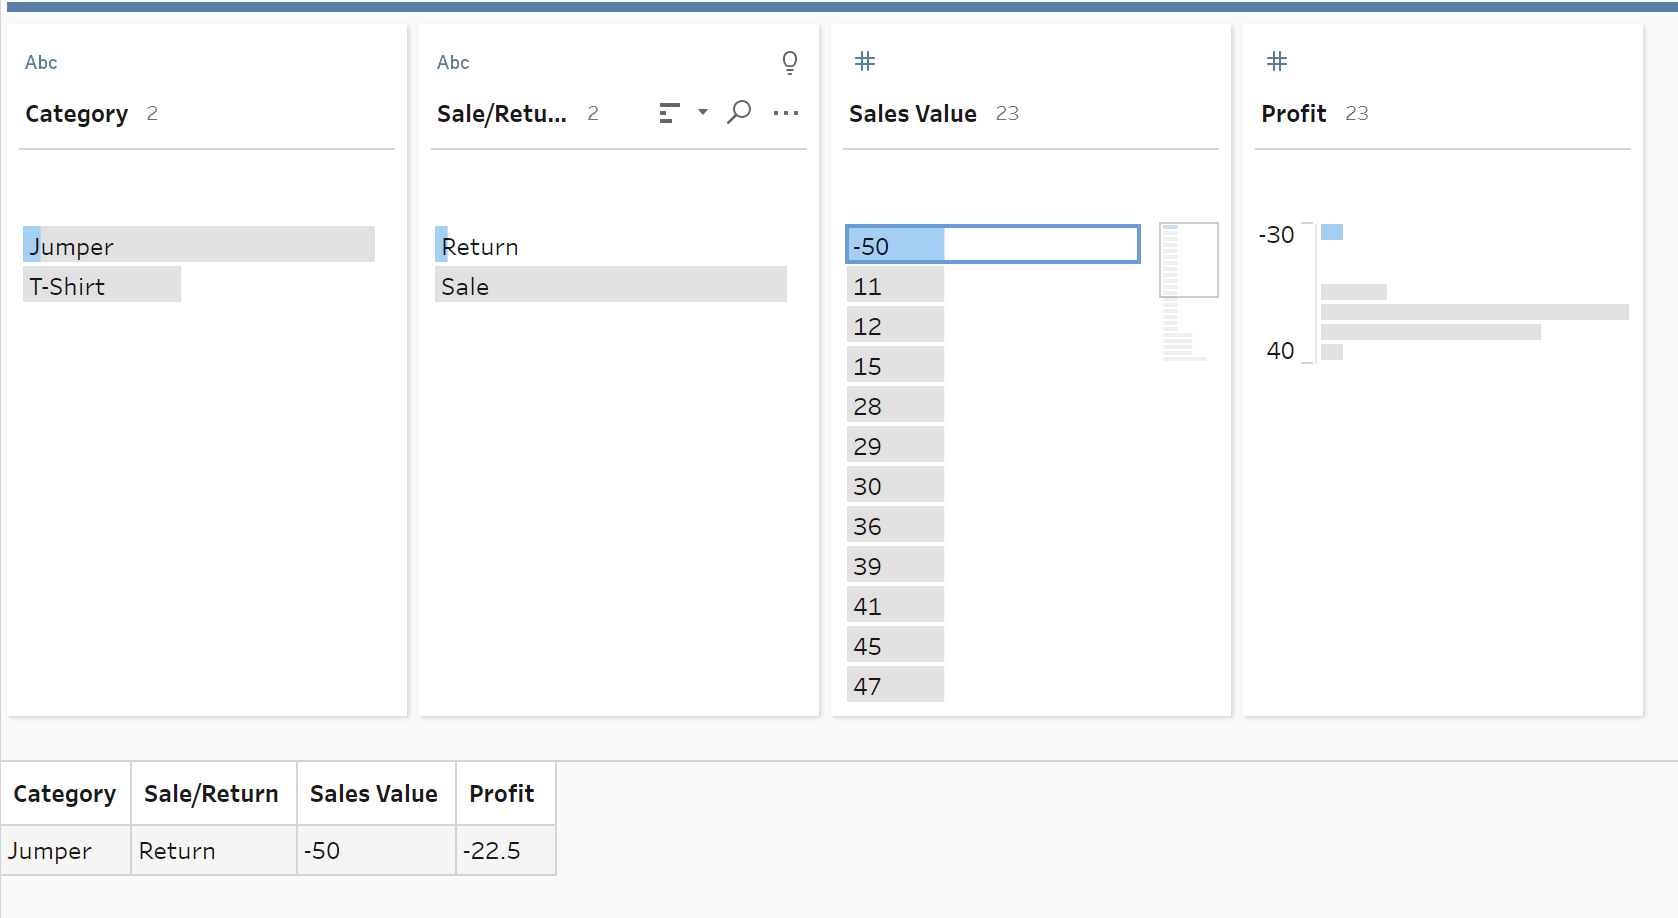
Tableau Prep (screenshot above), Alteryx and Power BI are all appropriate tools for data discovery as they all show a breakdown of the data in a similar way. From the breakdown of the sales Value column we can see that there is a negative value in our sales data. The beauty of Tableau Prep is that we can select that -50 value and it will show us that it actually corresponds to a return. hence it makes sense that we have a negative value.
Data Discovery is a great way to really understand the data you are working with, it helps you understan whether or not the data is fir for purpose. It should also highlight any inconsistencies at the start of the project as a pose to the end of the project.