


Hey everyone! So our task today was to analyse and evaluate one of Andy’s past visualizations across some of the dashboard practices he had taught us so far. The objective was to find areas on which we think we could improve and ultimately, produce a ‘better’ dashboard. I will try to blog as I go so you can see my thought process through this makeover (this could get messy so stick with me).
The Dashboard

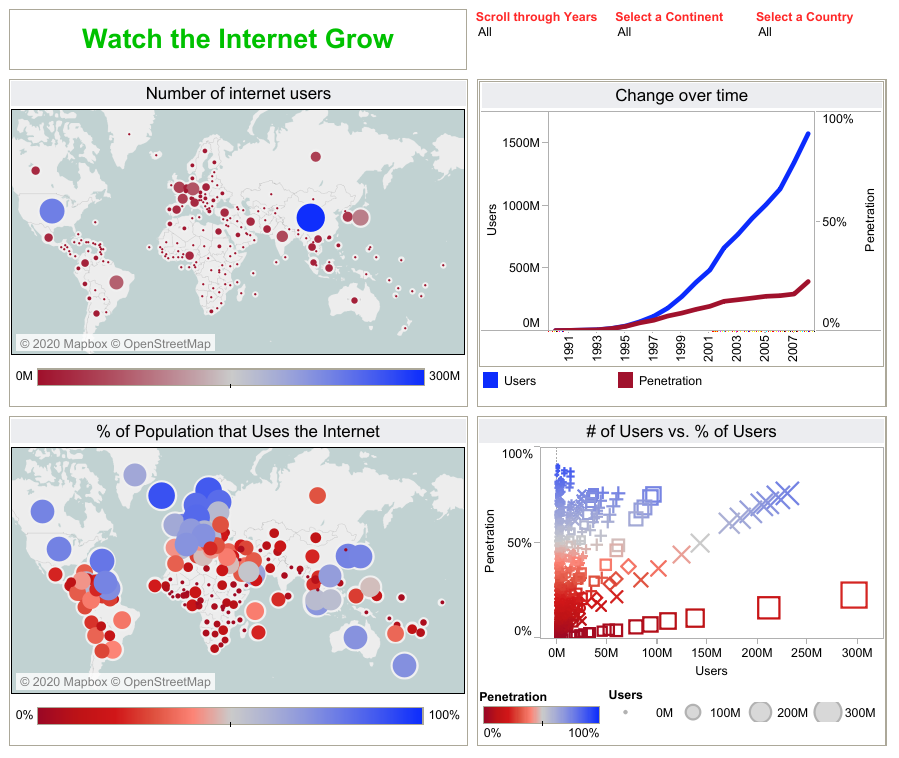
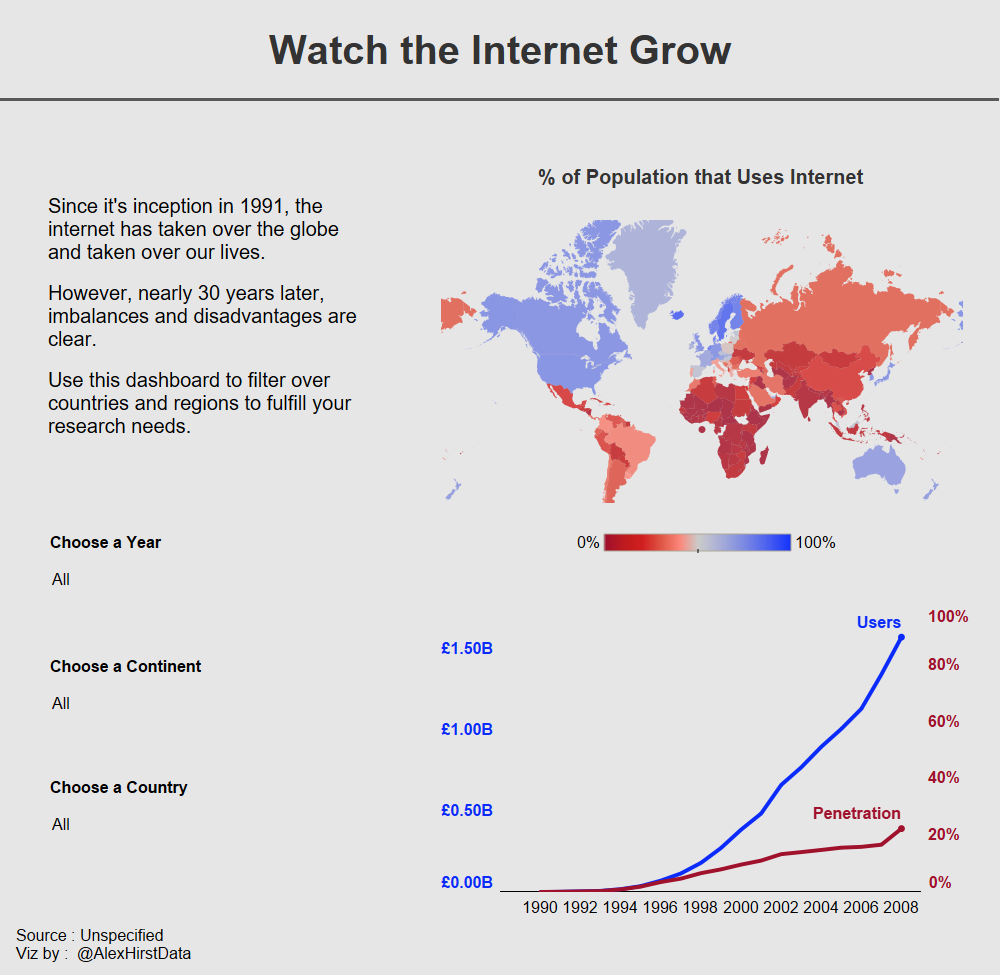
So initial impressions is there is a lot to take in. My eyes don’t immediately get drawn anywhere so it’s difficult to connect the title to any graph in particular. If we keep this title the only graph that backs this statement up (top right) would need more prominence. In addition, there seems to be no text and such, no way of guiding the reader through the visualization. There is also be four colours when two could suffice and the dashboard seems to need a bit more spacing.
I will try to go into the following sections as I improve; colours, spacing, graphs/charts, everything else.
The Makeover
Colours
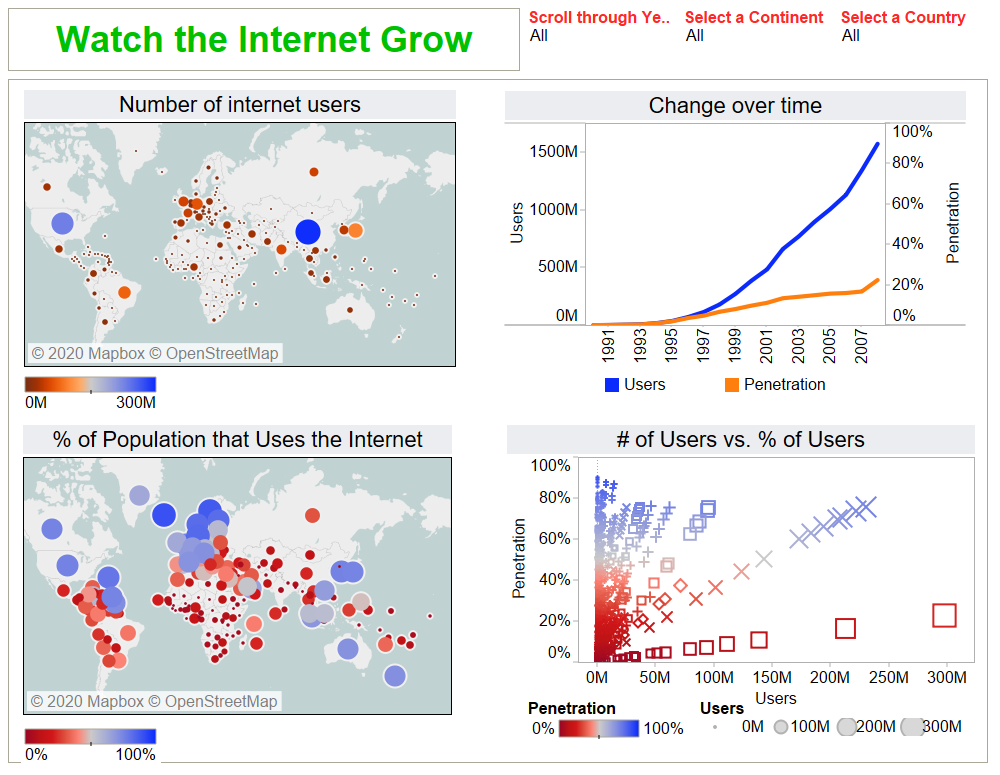
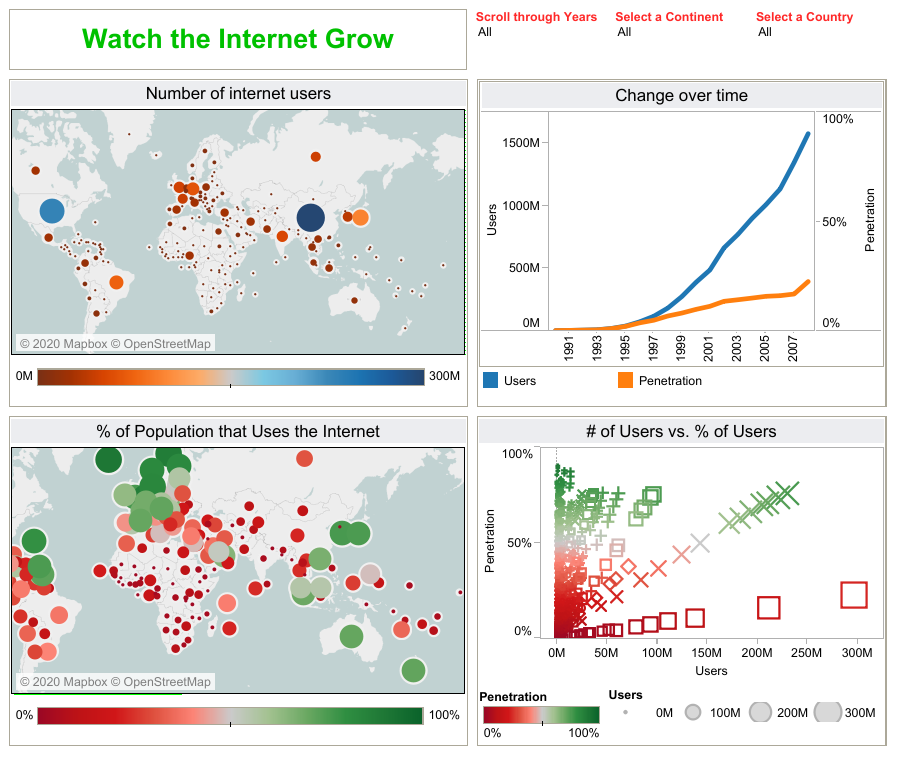
The diverging colour panels do work well to show the variety of results and can make clusters obvious (for example South America and Africa displaying low internet usage). However, does four colours need to be used in this visualisation when two could suffice? In addition, we’ve learnt a green to red colour palette is highly unadvisable due to the difficulty for the colour blind population. So let’s just stick with red to blue.
Spacing
Secondly, a bit more spacing could do wonders here. We’ve learnt about using column/row dividers sparingly but in some cases it can help to separate tight dashboards like this. I will increase the dashboard size and make the four graphs floating to try to let the dashboard breathe.
Graphs/Charts
The first thing I noticed is that there is two maps and more to the point, the bottom left map really isn’t that clear in some areas (Europe for example). Could we try a different type of map, potentially shading the countries rather than bubbles? Also, do we need both maps? Arguably, % of population that uses the internet is a much better indicator for analysis than absolute numbers as it gives context. I think it does, lets leave that graph out.
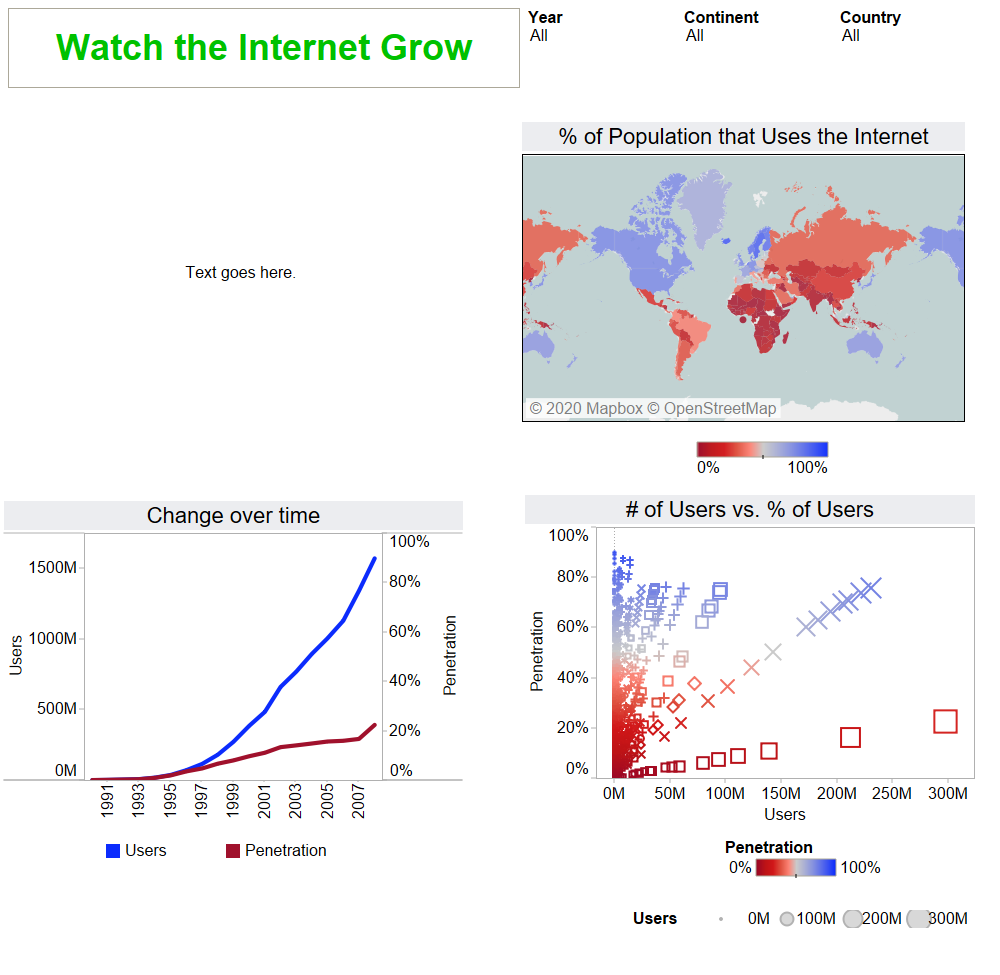
Now since we are chopping graphs, is there anything else we can do? Well if the single map now shows % of users, and the line graphs shows the # of users, I am starting to question the utility of the % vs # users graph. Besides, it doesn’t seem to be concluding much and it’s a bit all over the place. Regrettably, it also goes.

I admit, I have been strict in taking out some of these graphs but I want the visualisation to be a bit easier to digest. Where the first visualization was bit crowded, these graphs appear the most important and can tell the bulk of the story whilst keeping the value of the filters.
Everything Else
By everything else, I mean the little things that can clean up the graphs and help the design (the fun part). There is quite a few things I need to do so I will try to just bullet point them;
- Add text
- Add dashboard background (light grey or an off-white colour)
- Remove map background (oceans etc)
- Line chart – re-orientate date field for easier reading on the x-axis (I had to change the date field to continuous to allow this), change the y axis number formatting to millions. Take out column/row dividers. Label Lines and swap colours to reflect axis.
- Change title colour as green is now irrelevant to the colour palette. I will also remove borders.
- Re-arrange filters and offer a call-to-action phrase ‘change country’ etc
- Add source data/credits
And that’s it! Well, I’m out of time so that’s all I could do.
Original Viz
Makeover Viz
There is still a lot that needs to be done and quite a few questionable decisions along the way. I tried to simplify the viz to make it easier for the reader to make conclusions. Fixes I would’ve done with more time; not sure I like the triple axis graph (could make this two separate) and I would’ve found a better way to combine those two original maps. Also, my filters came through horribly – you can barely see them!
Anyways, I had fun and hope you enjoyed my messy walkthrough. It’s my first blog, let me off!
Link to Viz: https://public.tableau.com/profile/alexander.hirst#!/vizhome/InternetUsageMakeoverofAndysViz/InternetUsage?publish=yes (beware I haven’t beaten the scaling bug from Tableau Desktop to Tableau Public yet)