Hey! So this blog will be looking at Alteryx challenge #219. This challenge focuses on most of the favourites tools, as well as cross-tab, so this could be of help to a beginner (like me).
The Challenge
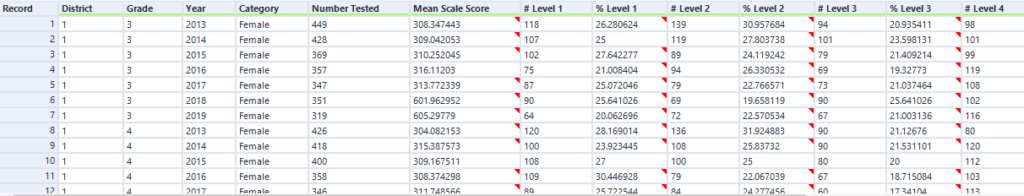
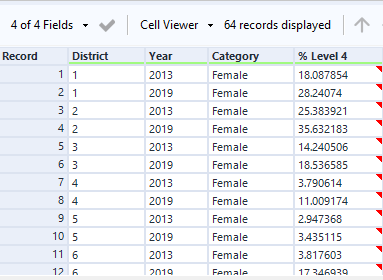
From this
To this
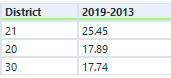
The challenge is find the 3 districts that have improved the most in grade 8, female scores between 2013 and 2019. Let’s go!
Step 1
We need to separate our criteria from the data. So grade 8, female and only the years 2013 and 2019. The FILTER tool well help us here.

Step 2
Right, that’s cleaned it up a bit…but not enough. Let’s pick up the SELECT tool and get rid of everything else which we don’t need.
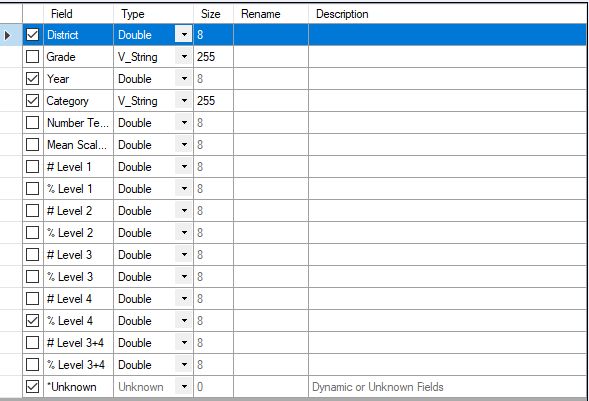
(You can take Category out as well)
Step 3
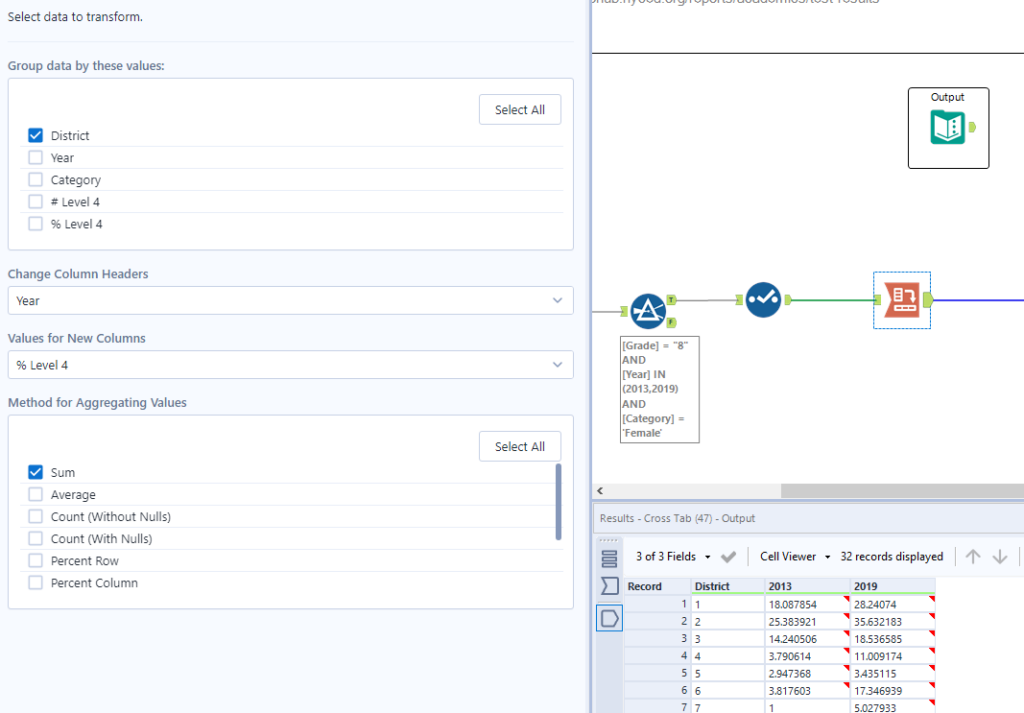
CROSS-TAB time.
So ideally, we’d want the years on the top and then the district’s can dominate the whole row, rather than being split across two.
So in CROSS-TAB, group the values by the district (so the years can be together on same row), and change the column headers to Year so we can get them on the top. Your values will be the level 4 %, and use Sum, but it doesn’t really matter as it’s just that one data point in each year.
Step 4
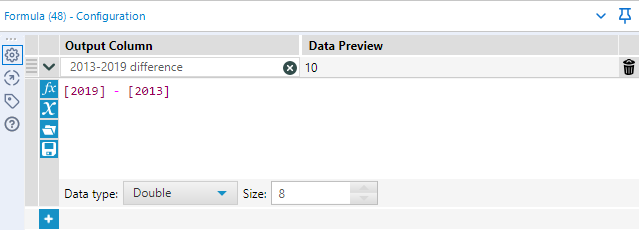
We want to know the difference between the 2013 and 2019 scores. A quick FORMULA tool will suffice.
Step 5, 6 and 7
Now we got all the info out, we just need to sort it.
SORT tool to sort by DESCENDING (so we get our biggest differences at the top).
SELECT tool to only select difference and district because everything else is now irrelevant.
And finally, SAMPLE to get those top 3 rows. Click on First N rows, and then click 3 rows.
DONE!
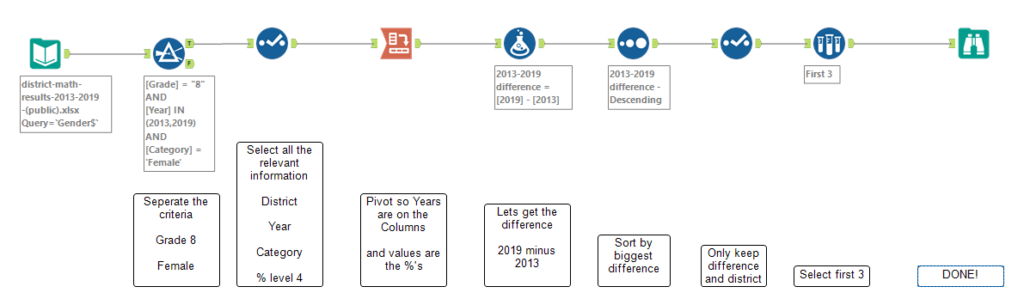
Finished Workflow;