


What is an LOD?
LOD stands for "Level of Detail." Level of Detail expressions in Tableau allow you to control the granularity or level of detail at which a calculation is performed in your data visualization. They provide a way to compute values at a different level of detail than what is currently displayed in your view.
There are three main types of LOD expressions in Tableau:
- FIXED: A FIXED LOD expression allows you to compute a value based on a specific dimension or set of dimensions, regardless of what dimensions are currently in your view. It fixes the level of detail for the calculation.
- INCLUDE: An INCLUDE LOD expression allows you to include a dimension or dimensions in your calculation, even if they are not part of your view. This allows you to compute values at a higher level of detail than what is currently displayed.
- EXCLUDE: An EXCLUDE LOD expression allows you to exclude a dimension or dimensions from your calculation, even if they are part of your view. This allows you to compute values at a lower level of detail than what is currently displayed.
LOD expressions are particularly useful when you need to perform calculations that involve aggregations or comparisons at different levels of detail within your data. They provide a way to control the context in which calculations are executed, giving you more flexibility in creating complex visualizations and insights in Tableau.
But enough talk. Let's see LODs in action, starting with a simple example:
Suppose we start with this table:
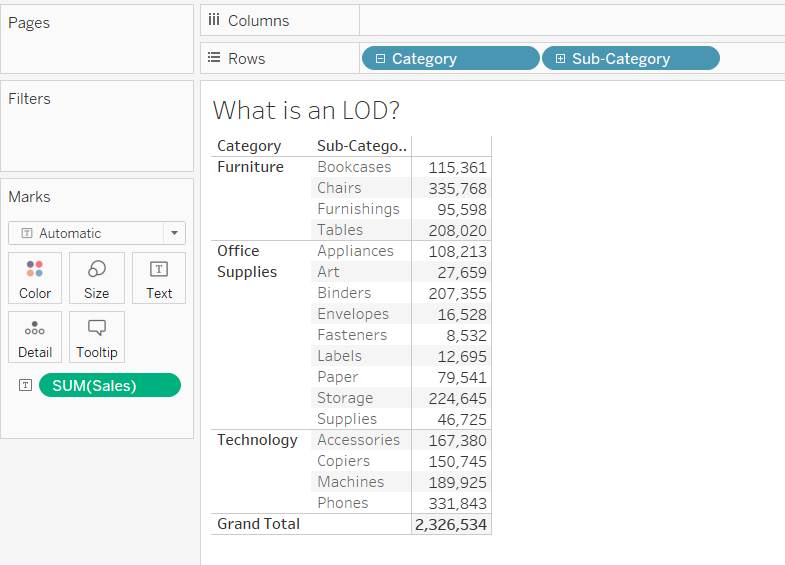
Currently, we sees sum of sales for each individual sub-category within their respective categories. Supposed we want to see the sum of sales for each category instead?
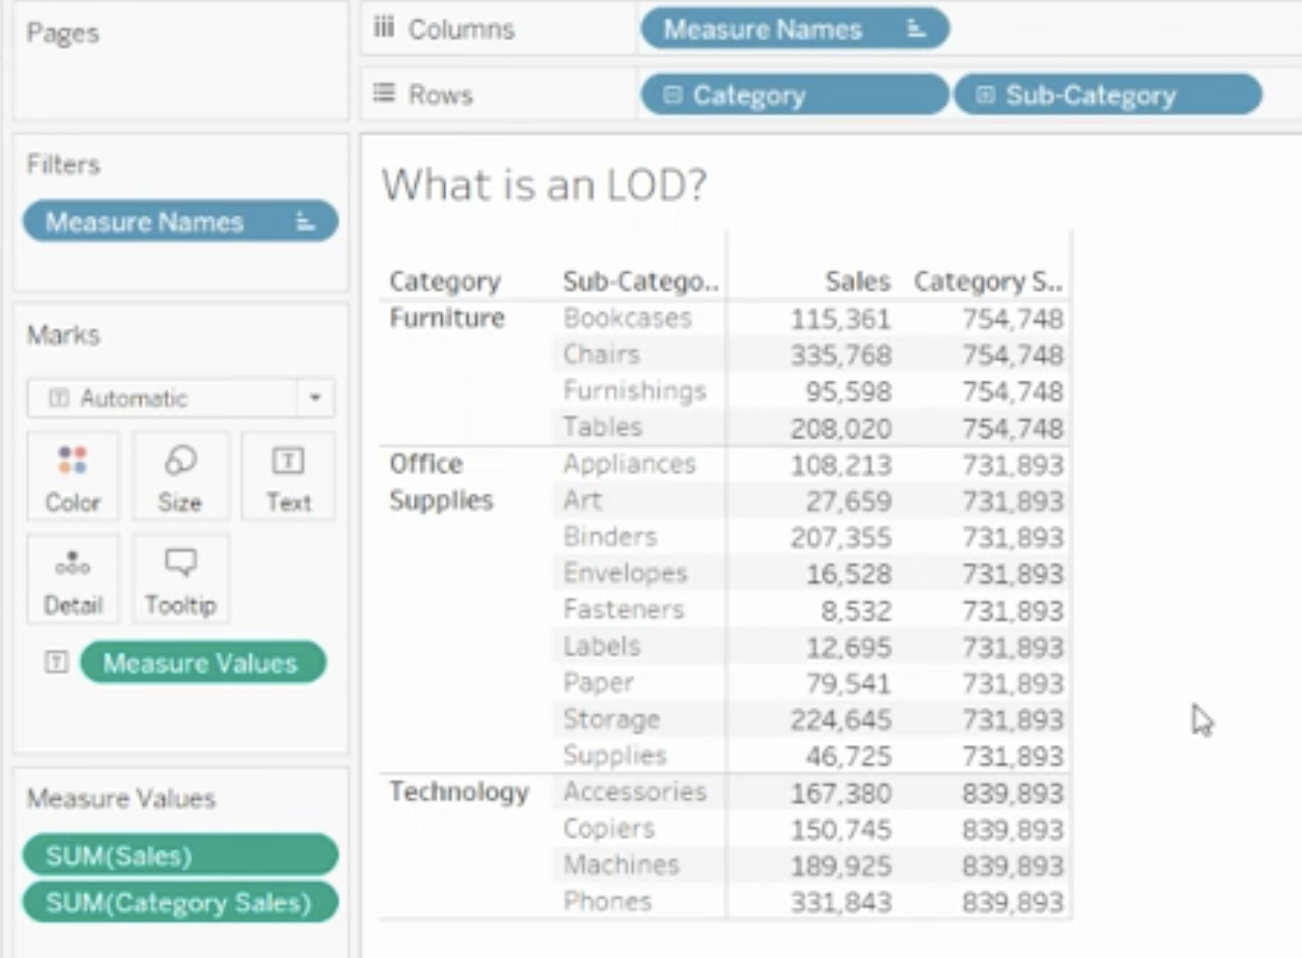
Create a calculated field and name it “Category Sales”:
{FIXED [Category]: SUM(Sales)}
This calculation translates to - For each Category (FIXED), give me (:) the sum of sales. The result is that for each sub-category of the furniture category, we see a sum of sales for that category.
Drag the Category Sales to the table.
Some points to consider about this calc statement:
- In Alteryx "speak," this is like saying Group by Category, give me the Sum of sales.
- The right-hand side of a level of detail expression must be an aggregation, e.g. sum, average, max, min, count distinct, etc.
- But I use an aggregated field, such as profit ratio, I wouldn’t need another aggregation.
We can show column totals by:
Clicking on: Analysis > Totals > Show Column Grand Totals
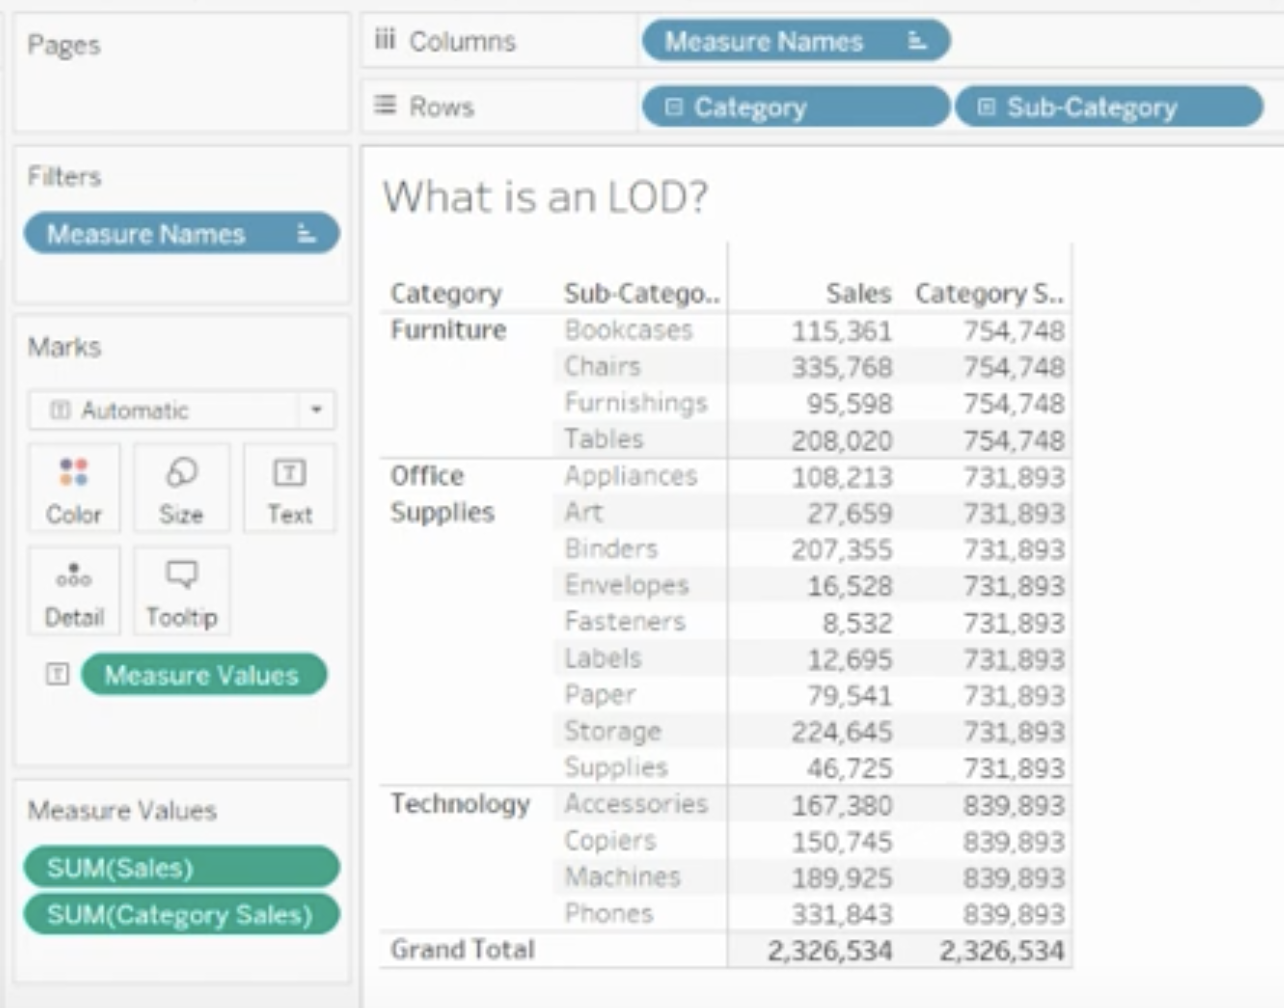
Tableau is smart enough to summarize three numbers for each of the furniture categories to get the Grand Total for Category Sales, even though the Category Sales numbers are repeated multiple times for each category.
It’s always best to build a table view first to get the numbers correct (as in this demonstration), then build your graphs and charts.
Let's calculate sales % of category sales:
Create a calculated field and name it “% Category Sales by Sub-Category”:
SUM([Sales]) / SUM([Category Sales])
Drag the “% Category Sales by Sub-Category” pill to Measure Values card.
Format the number to percentages (Right-click the pill > Format > Default Numbers > Percentage > Choose Decimal Places to 0)
Note that the percentages of each category add up to 100%. If we add up the total percentages for each category, we would get 300%, but the Tableau percentage Grand Total is 100%! Mind blown yet?
Let's created another calculated field called “Total Sales”:
{FIXED : SUM([Sales]) }
This says fixed on nothing - across all the dataset - and give me the sum of sales
Another way to say this is just leave out the word “FIXED” and write:
{SUM([sales])}
Drag the “Total Sales” to the Measure Values shelf and will see a column of Total Sales on every row. It’s the total sales of the entire table repeated on every row:
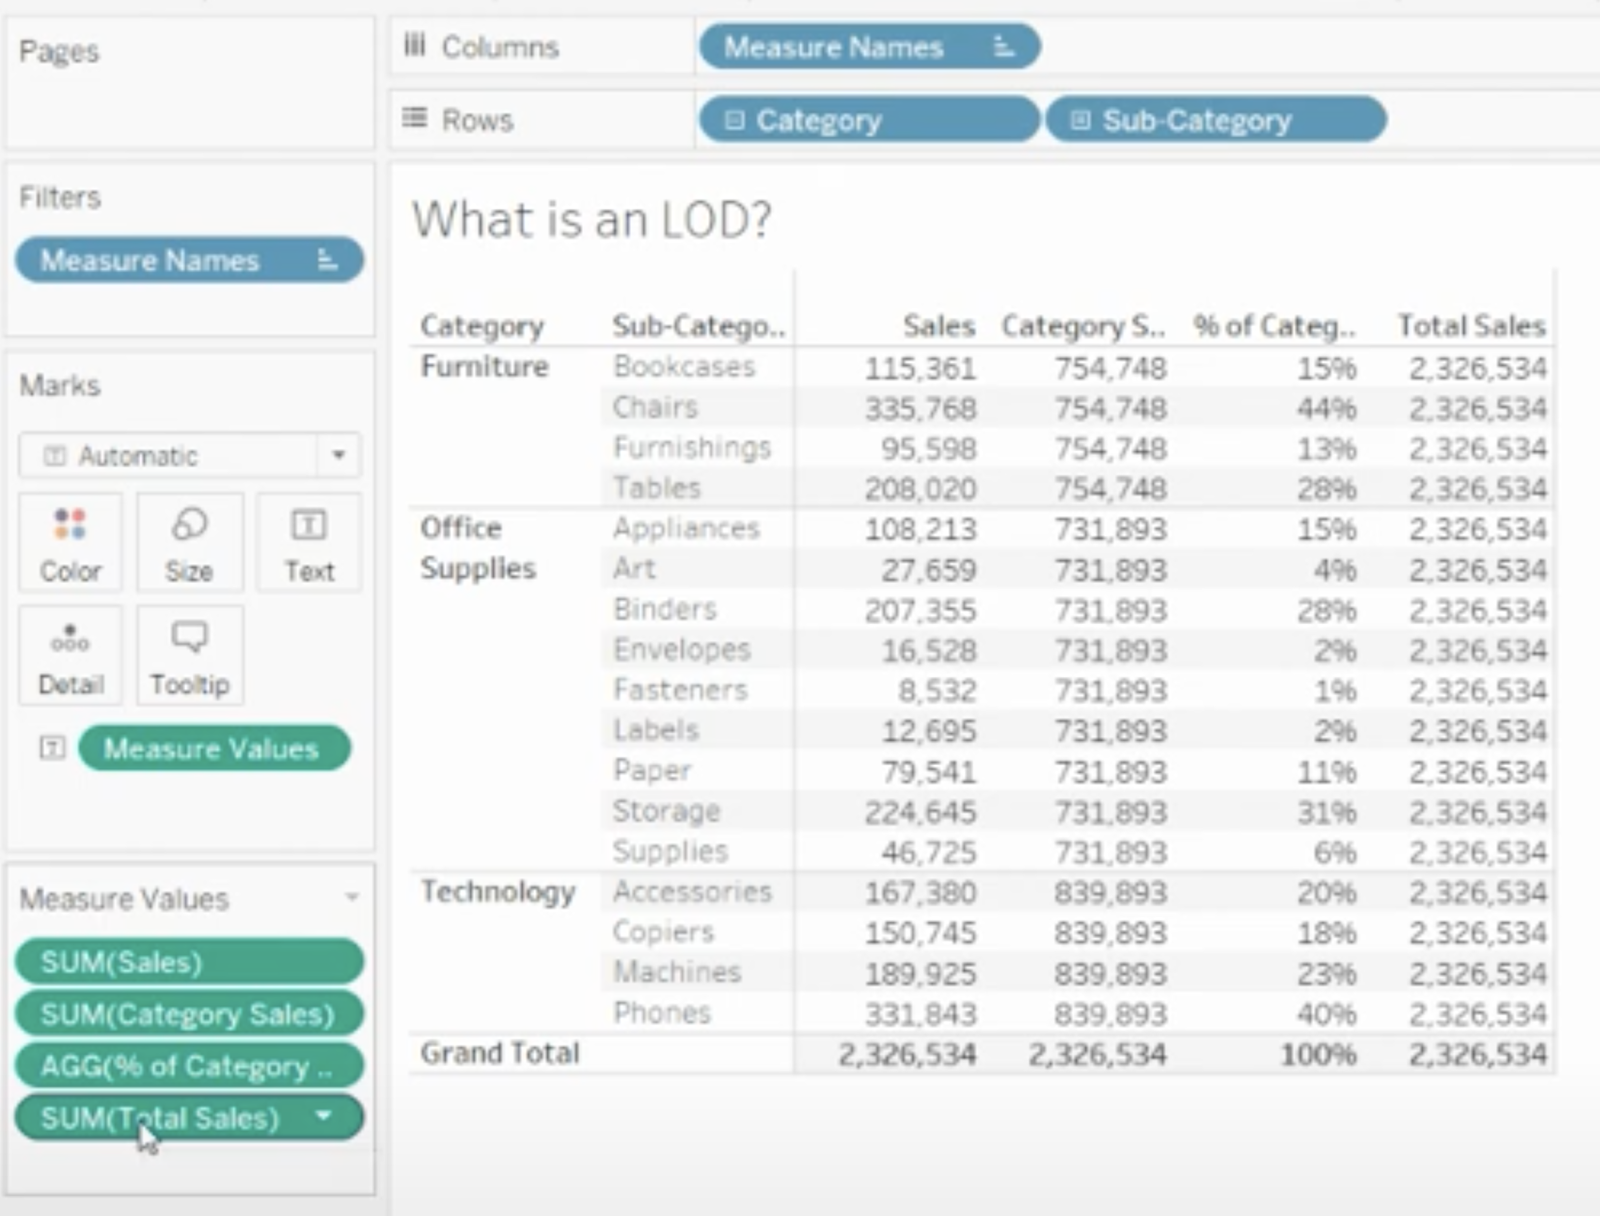
Create yet another calculated field and name it “% of Total Sales by Sub-Category”:
SUM([Sales]) / SUM([Total Sales])
Drag the “% of Total Sales by Sub-Category” pill to the Measure Values card and format the number to percentage with 0 digits after decimal
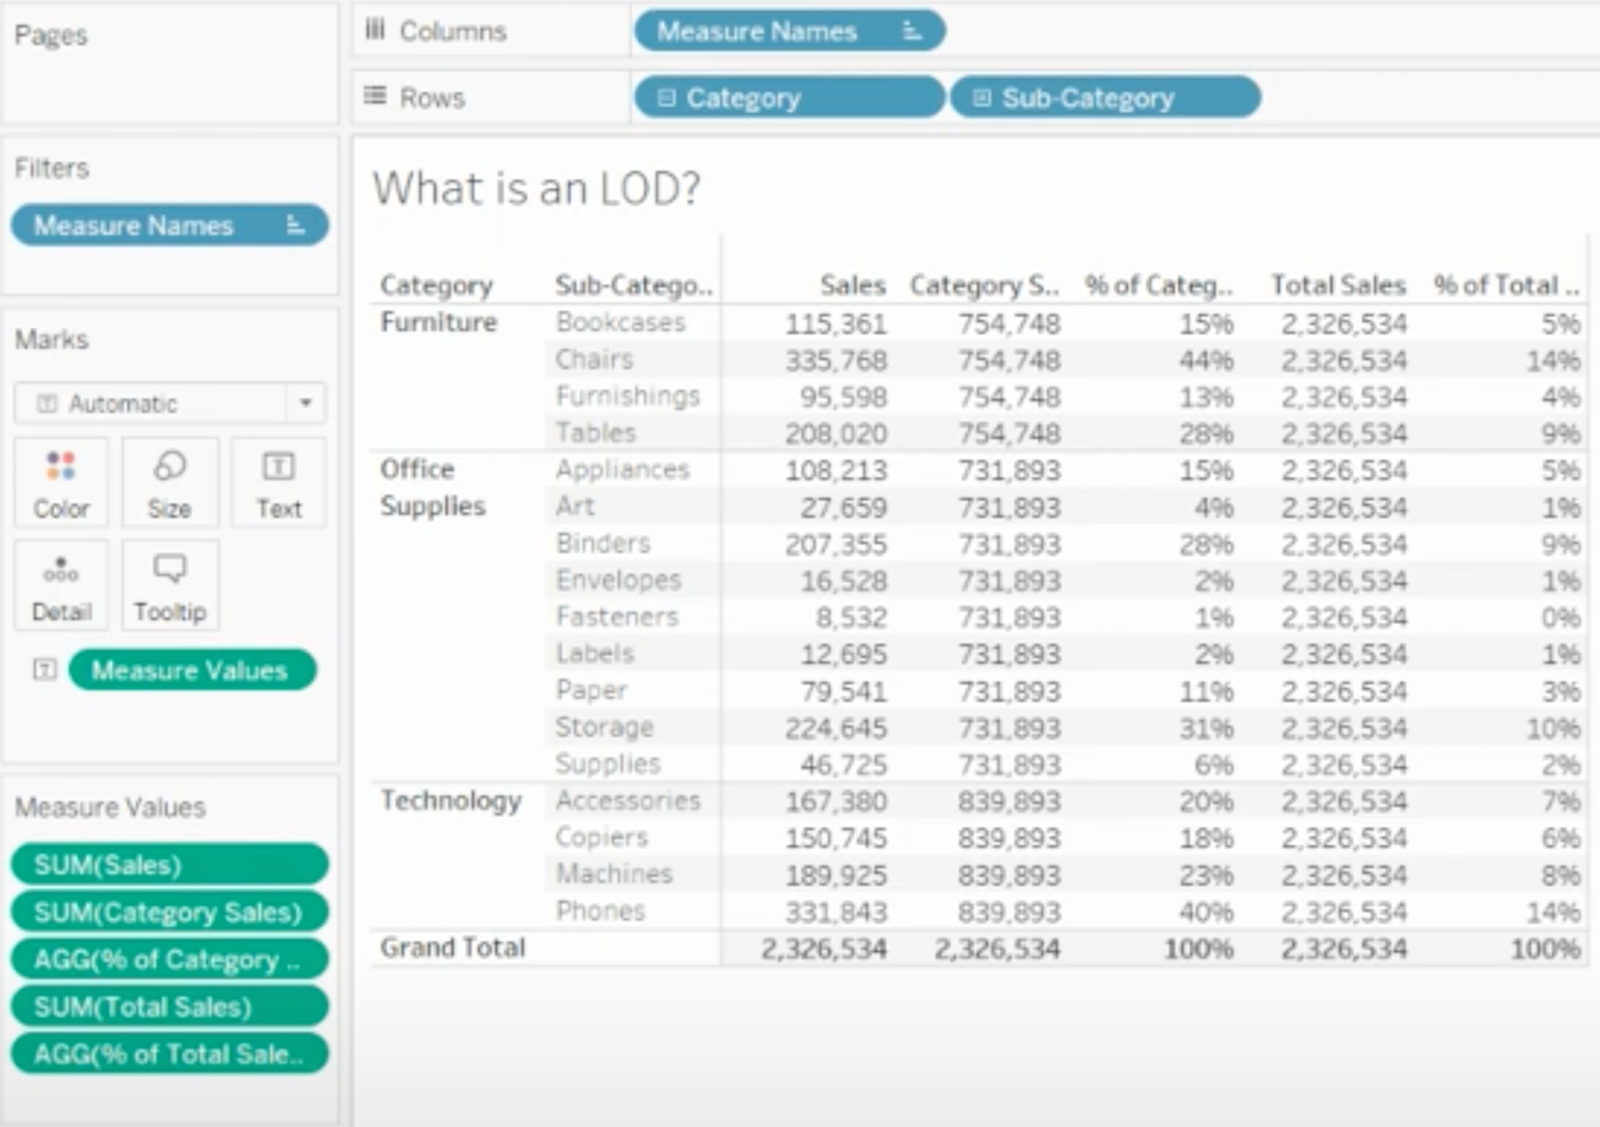
Now, we're able to see the percent of total sales for each sub-category! It's the magic of LODs...