


When building a dashboard, it's crucial to understand who your end user is. Unless your audience consists of data-savvy peers, they likely have a different perspective, objectives, and understanding of what they're viewing. This is why, before creating a visualization, consider the perspective of those you wish to inform with your findings.
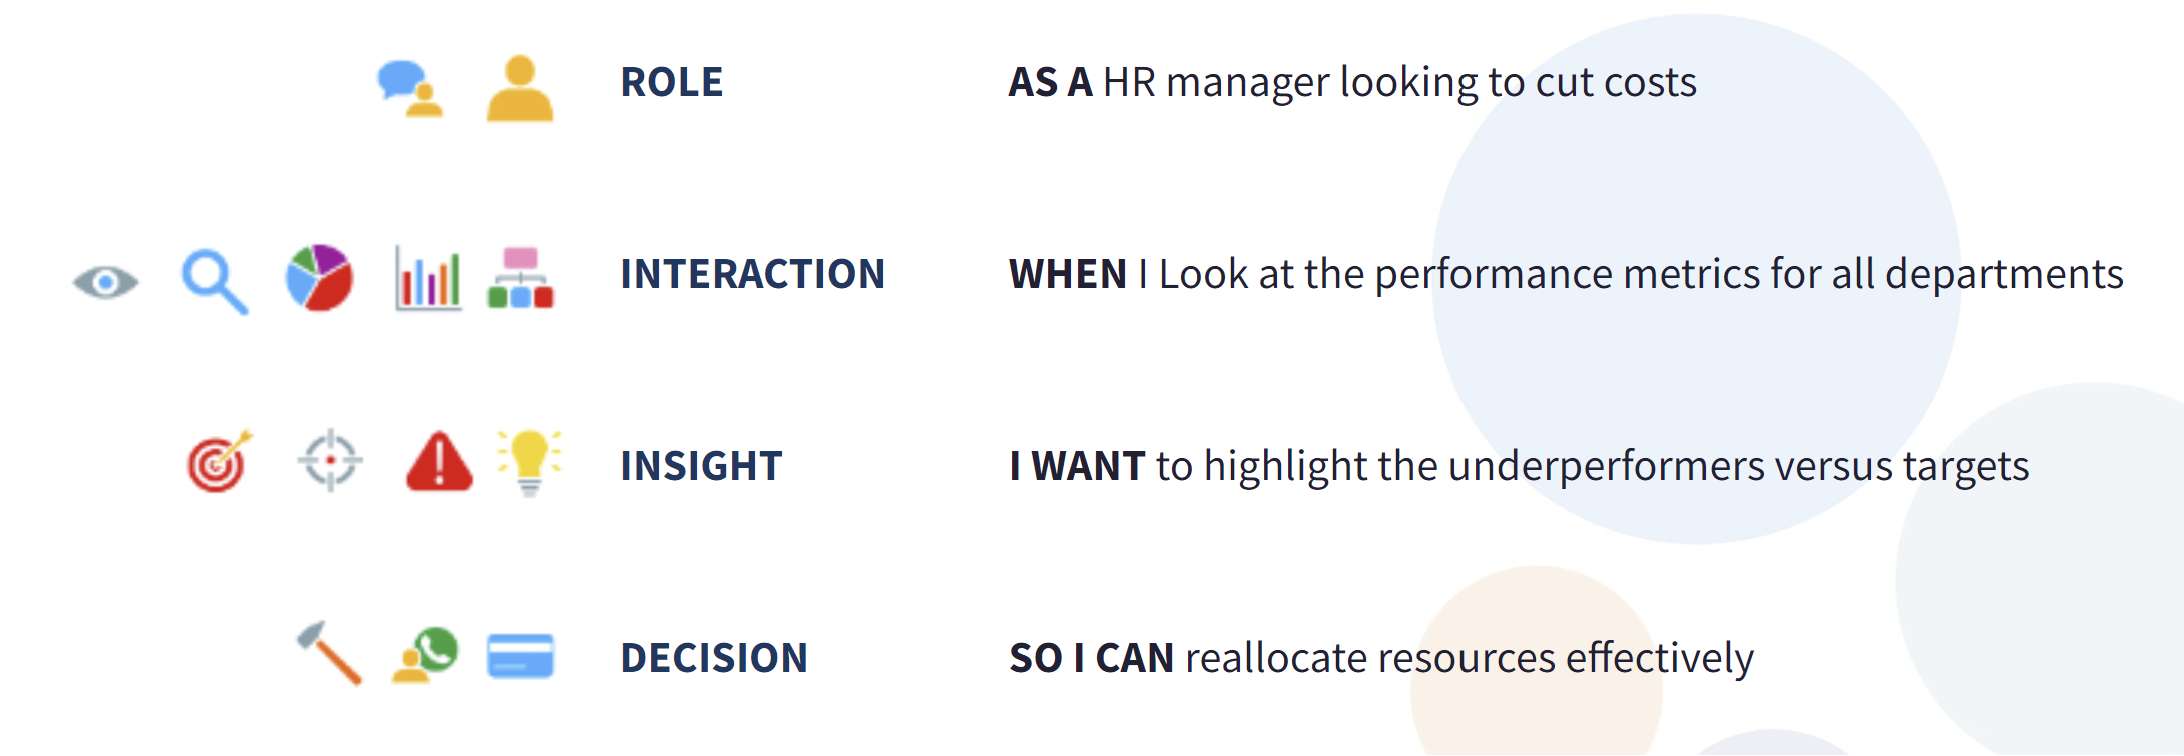
This is where the concept of a User Story comes into play. You can better understand the end user by focusing on four key aspects:
- ROLE - Who is your user? Are they a top executive planning business expansion? Or a Sales Rep looking for a deep dive into the market, its needs, trends, and key players? Understanding the user's role can help you comprehend their perspective as well as the detail they want to see.
- INTERACTION - How will your user engage with the visualization? A top executive will likely want top-line data, prepared findings, and crucial information for quick decision-making, especially before a board meeting. Conversely, a market analyst might prefer a more exploratory dashboard, allowing for a detailed examination of trends at various granularity levels.
- INSIGHT - What information does your end user need? For example, a potential investor evaluating an investment opportunity might need specific answers - Is the business model viable? What's the size of the target demographic? Can it financially survive in today's economy? The Insight part of the User Story should answer these questions, by understanding what kind of actionable insight your audience needs.
- DECISION - Ultimately, your end user wants the dashboard to facilitate their decision-making. Understanding their initial objectives is essential in determining the type of analysis they need. Remember that some stakeholders may require follow-up questions to clarify what they're attempting to answer. Comprehending their dilemma is important in guiding them through the relevant data.
Lastly, keep in mind that your perspective may change after spending hours with a dataset. It's crucial to occasionally step back from your work and review your results as if you're seeing your visualization for the first time! This helps identify any unclear parts of the analysis or areas requiring further explanation before submitting your work.