Today we were tasked with preparing a dashboard based on the LEGO data placed on a SQL server. The first challenge focused on identifying all the relevant tables and understanding how to relate them to pull up all the necessary data.
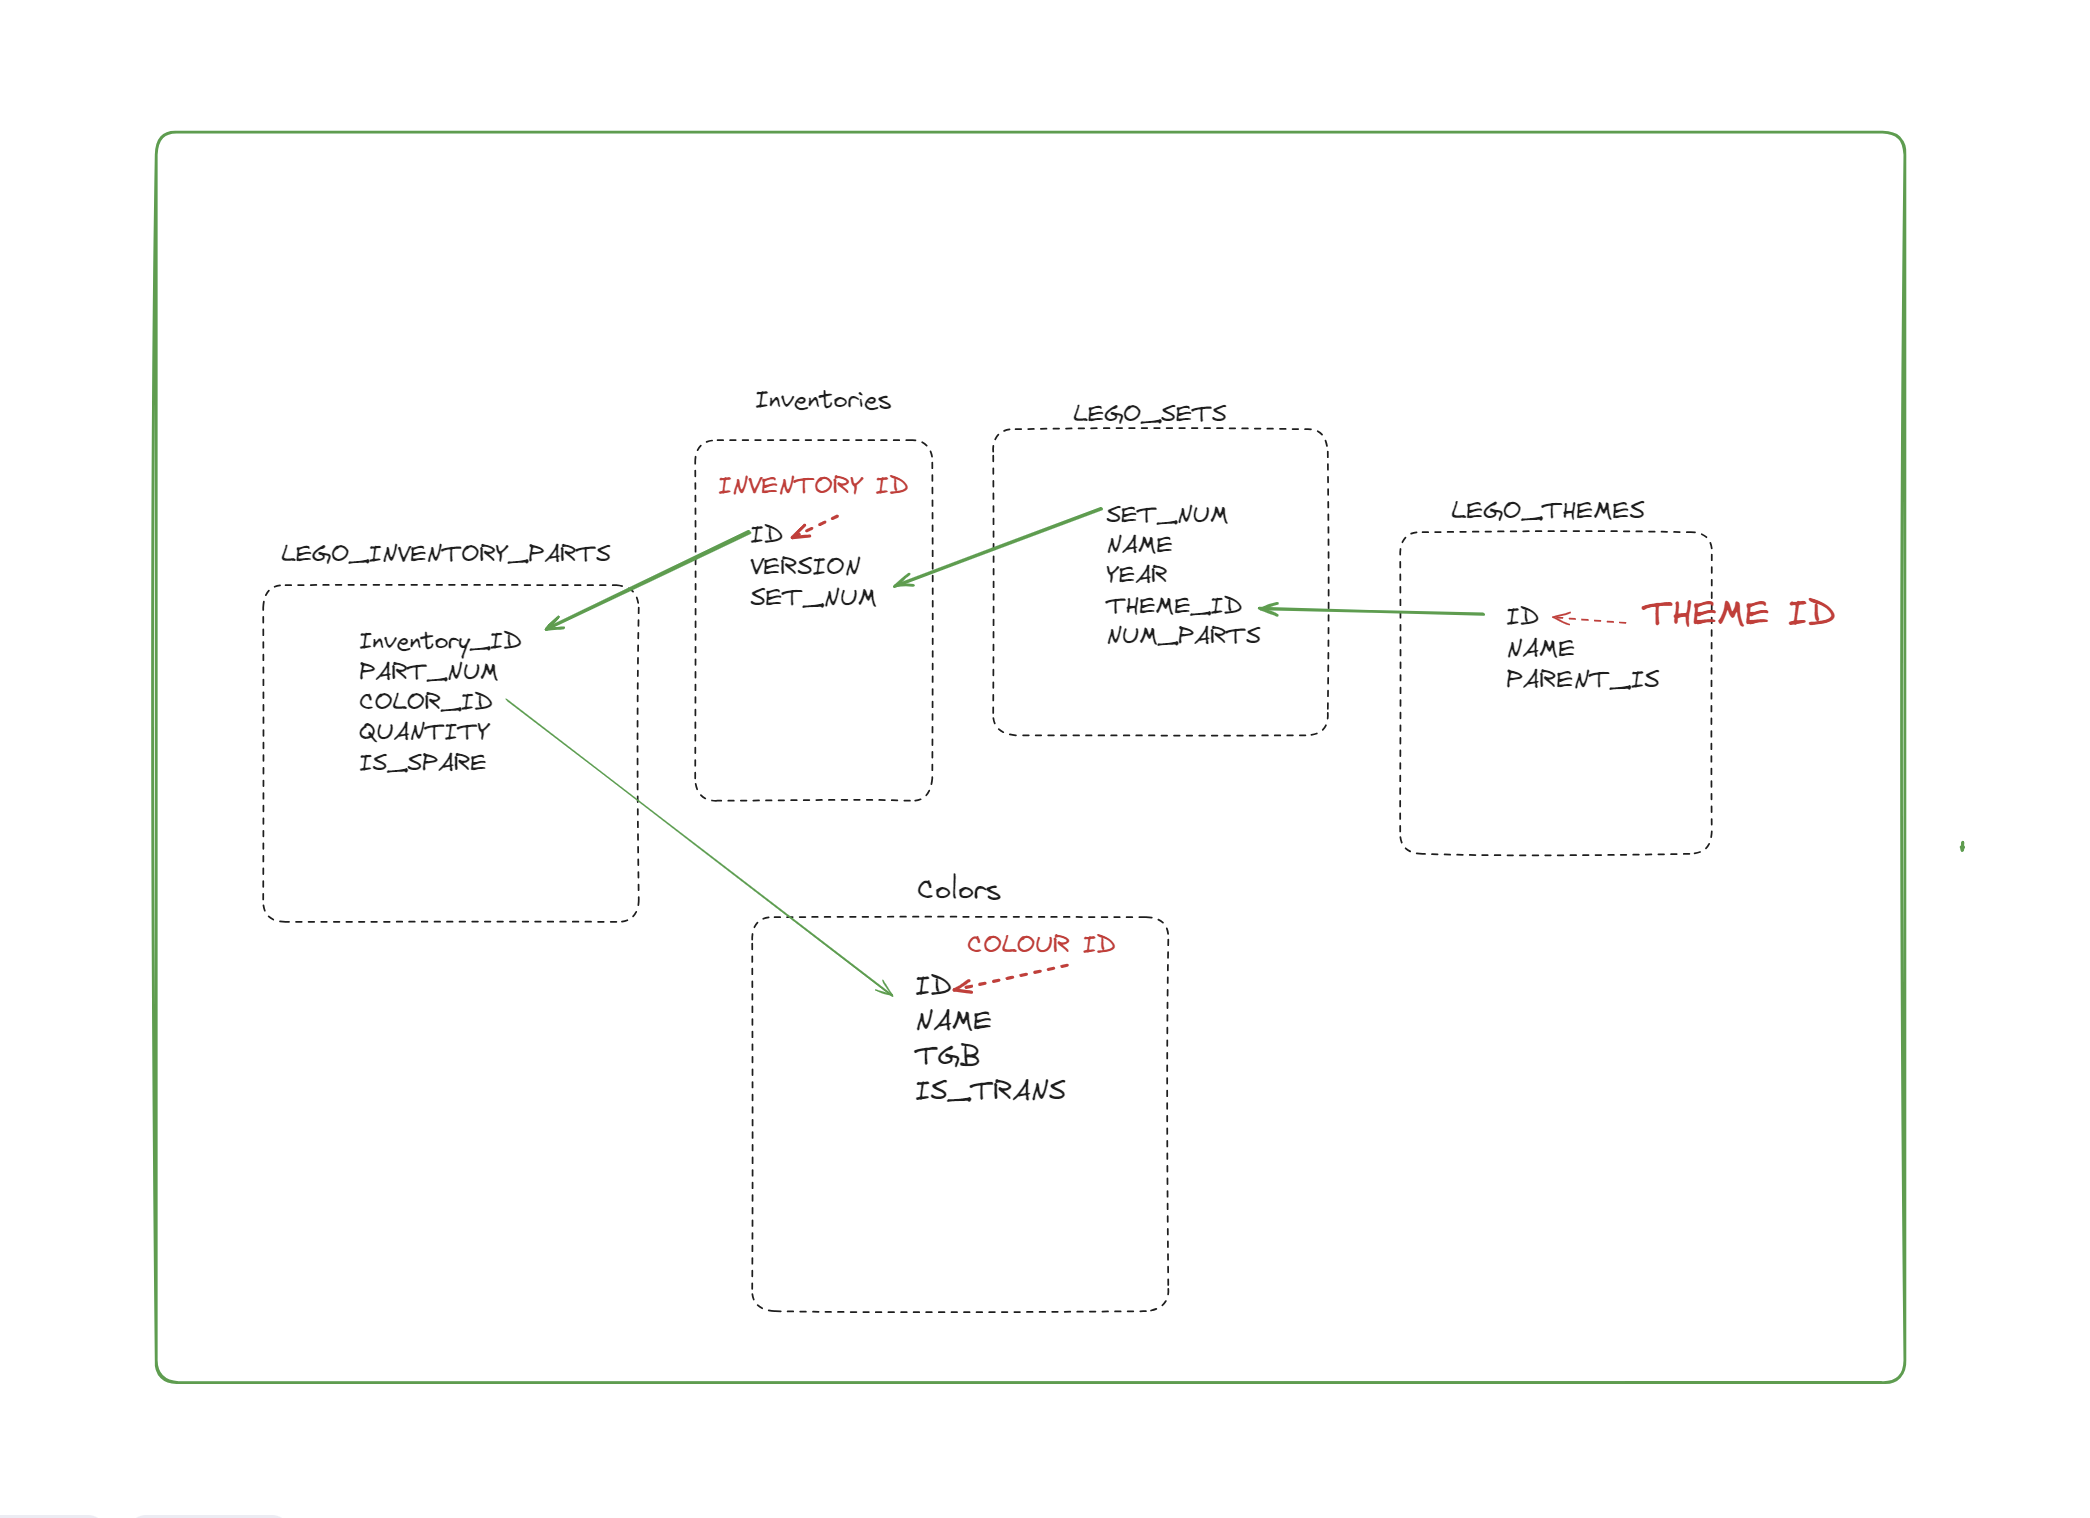
To do that I created a schema which included only the tables I found relevant for my analysis.
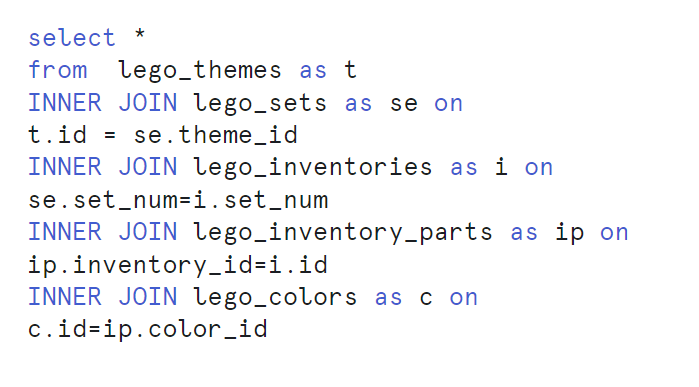
Using this simple SQL query I ended up with a (quite hefty) table containing over 500k records, with the granularity defined by the set, colour and quantity.
My initial plan was to create a dashboard which looked into the most 'popular' brick type and provided as much detail as possible about it, including contextual data as to how its metrics compare to other bricks.
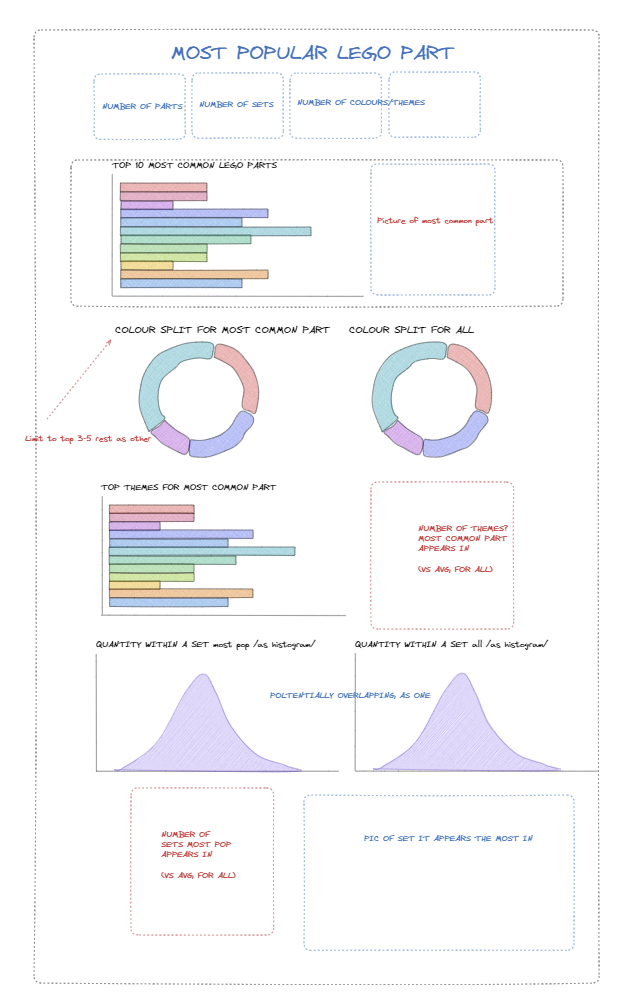
In the beginning, I came up with this sketch:
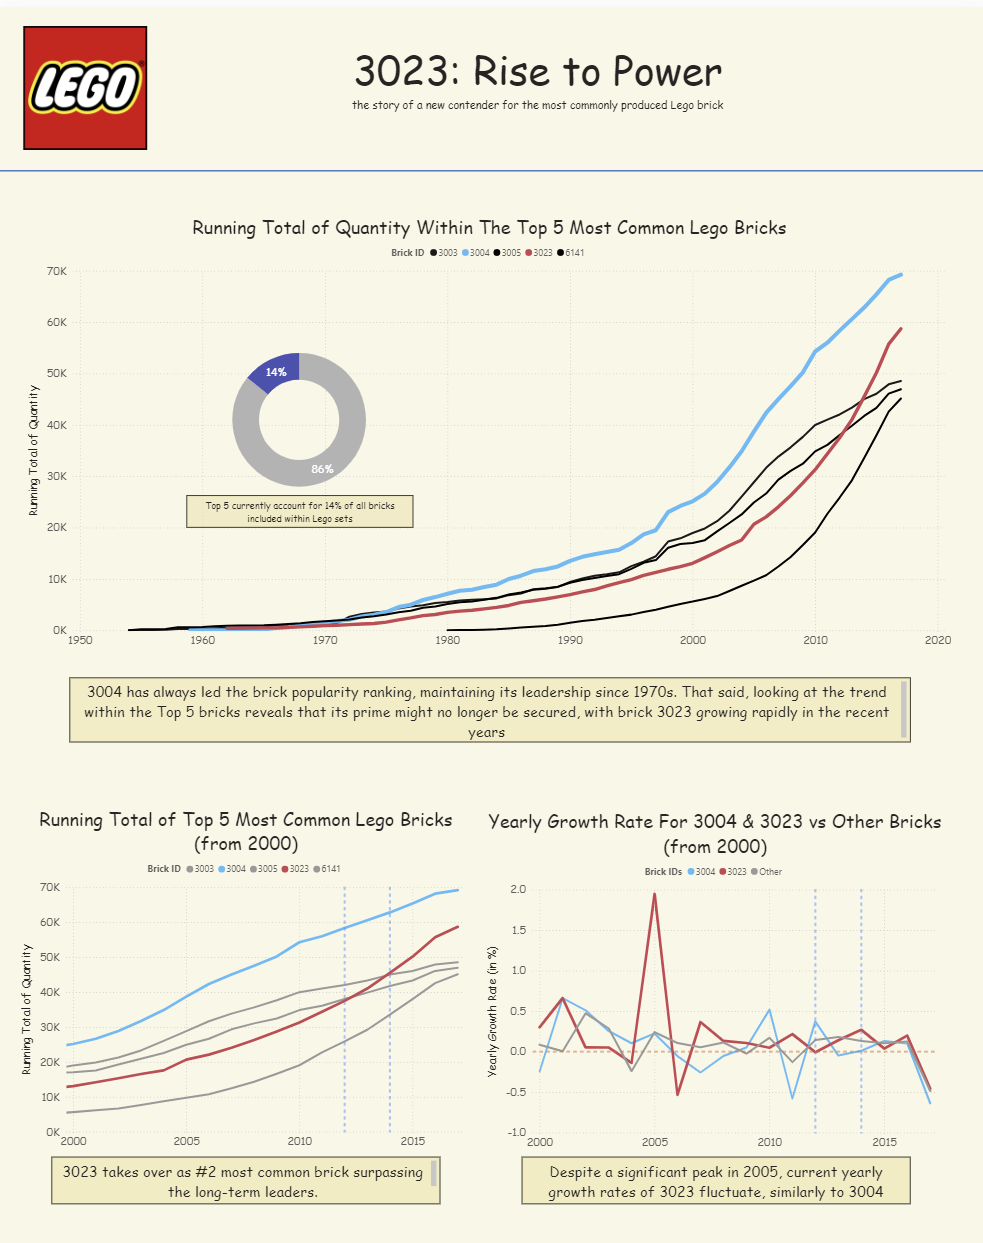
However, after looking into initial chart building, I noticed an interesting trend relating to how the most popular bricks have featured overtime. Namely, I noticed that a part 2032 has recently jumped to a podium place and was on track to become the most popular part, potentially taking over from the long-term leader - 3004.
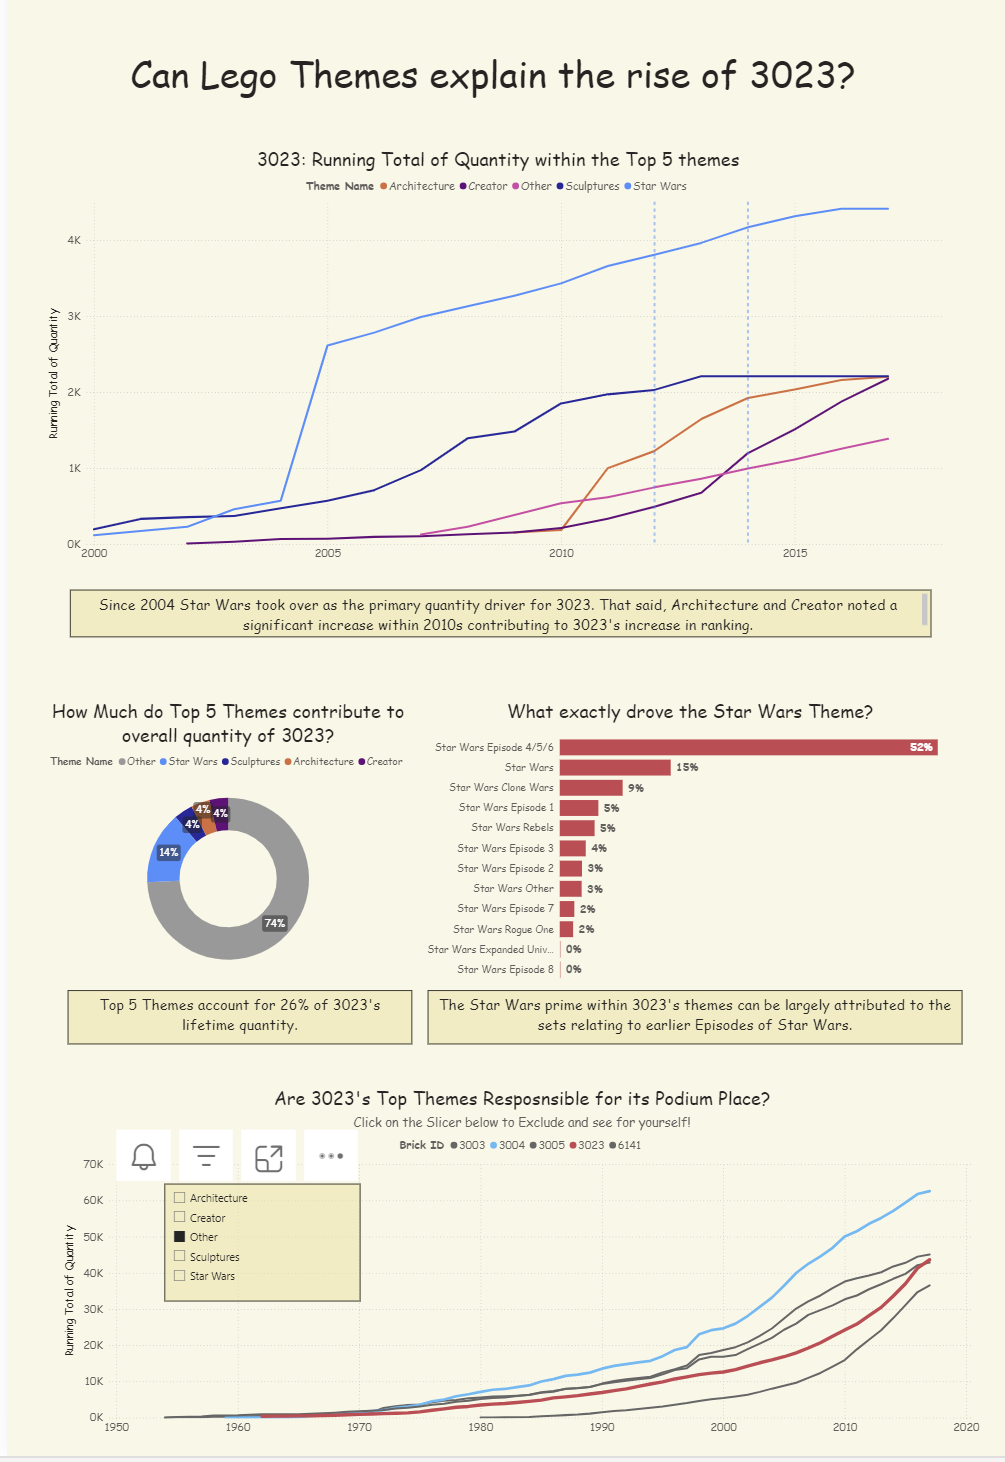
After exploring that finding further, I decided to pivot towards this story and focus on the analysis of 2032 and what has triggered its increase in popularity. This, resulted in the following final product: