


Table calculations in Tableau are calculations that run on the numbers already displayed in your view, rather than on the original dataset. Tableau takes the aggregated results you’re seeing and performs an extra layer of analysis on top of them. They’re especially useful for things like running totals, moving averages, rankings, and percent-of-total, where the insight depends on how values relate to each other in the table.
FIXED LOD (Level of Detail) expressions let you create values at a specific level of detail before the data reaches the view. This is helpful when you need a consistent number that doesn’t change as filters or the layout of the worksheet changes. Together, FIXED LODs and table calculations allow you to control both the level at which a value is created and how it behaves once it appears in the view.
I’ll now walk through a simple example to show how this works in practice and how the calculation changes once the direction and grouping are defined.
Example:
Using the Superstore dataset, we want to find out what percentage of products were profitable within each sub category.
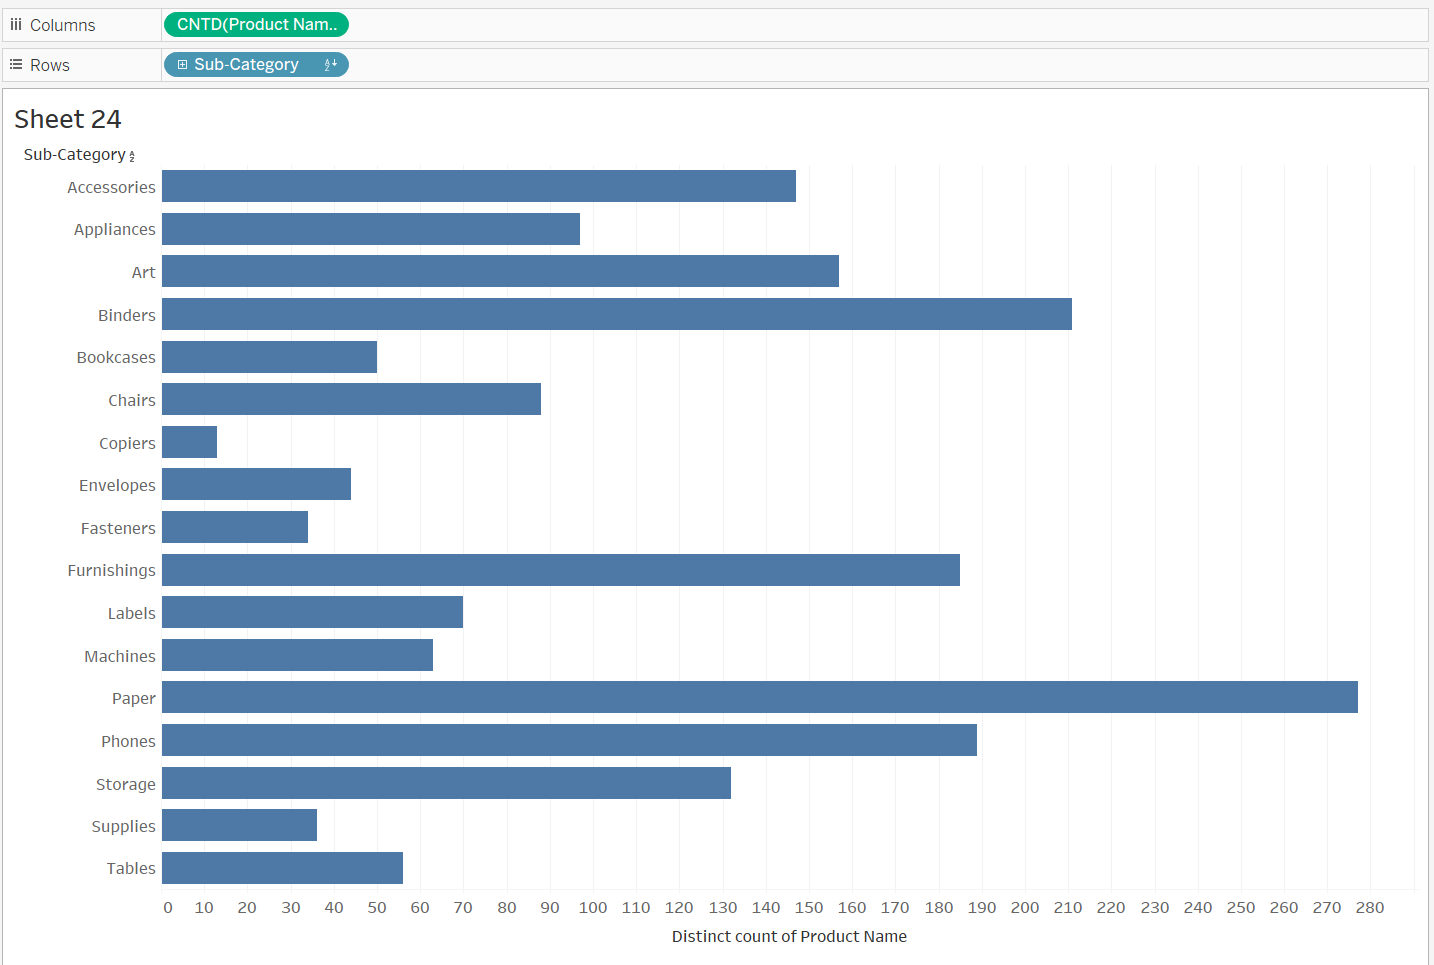
1) To begin, Place Sub-Category on the Rows shelf, then add a COUNTD(Product Name) to the Columns shelf to show how many unique products sit within each sub-category.
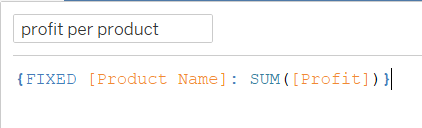
2) We first create a FIXED LOD to return the total profit for each product. This locks the value at the product level so it remains consistent regardless of how the view changes.
3) Now that we have this, the next step is to identify how many products within each sub-category were actually profitable. To do that, we need a new calculated field.
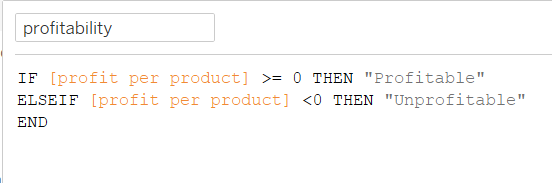
This calculation groups each product into either “Profitable” or “Unprofitable” based on its profit value from the LOD. If the profit per product is zero or above, it’s labelled as profitable; if it’s below zero, it’s labelled as unprofitable.
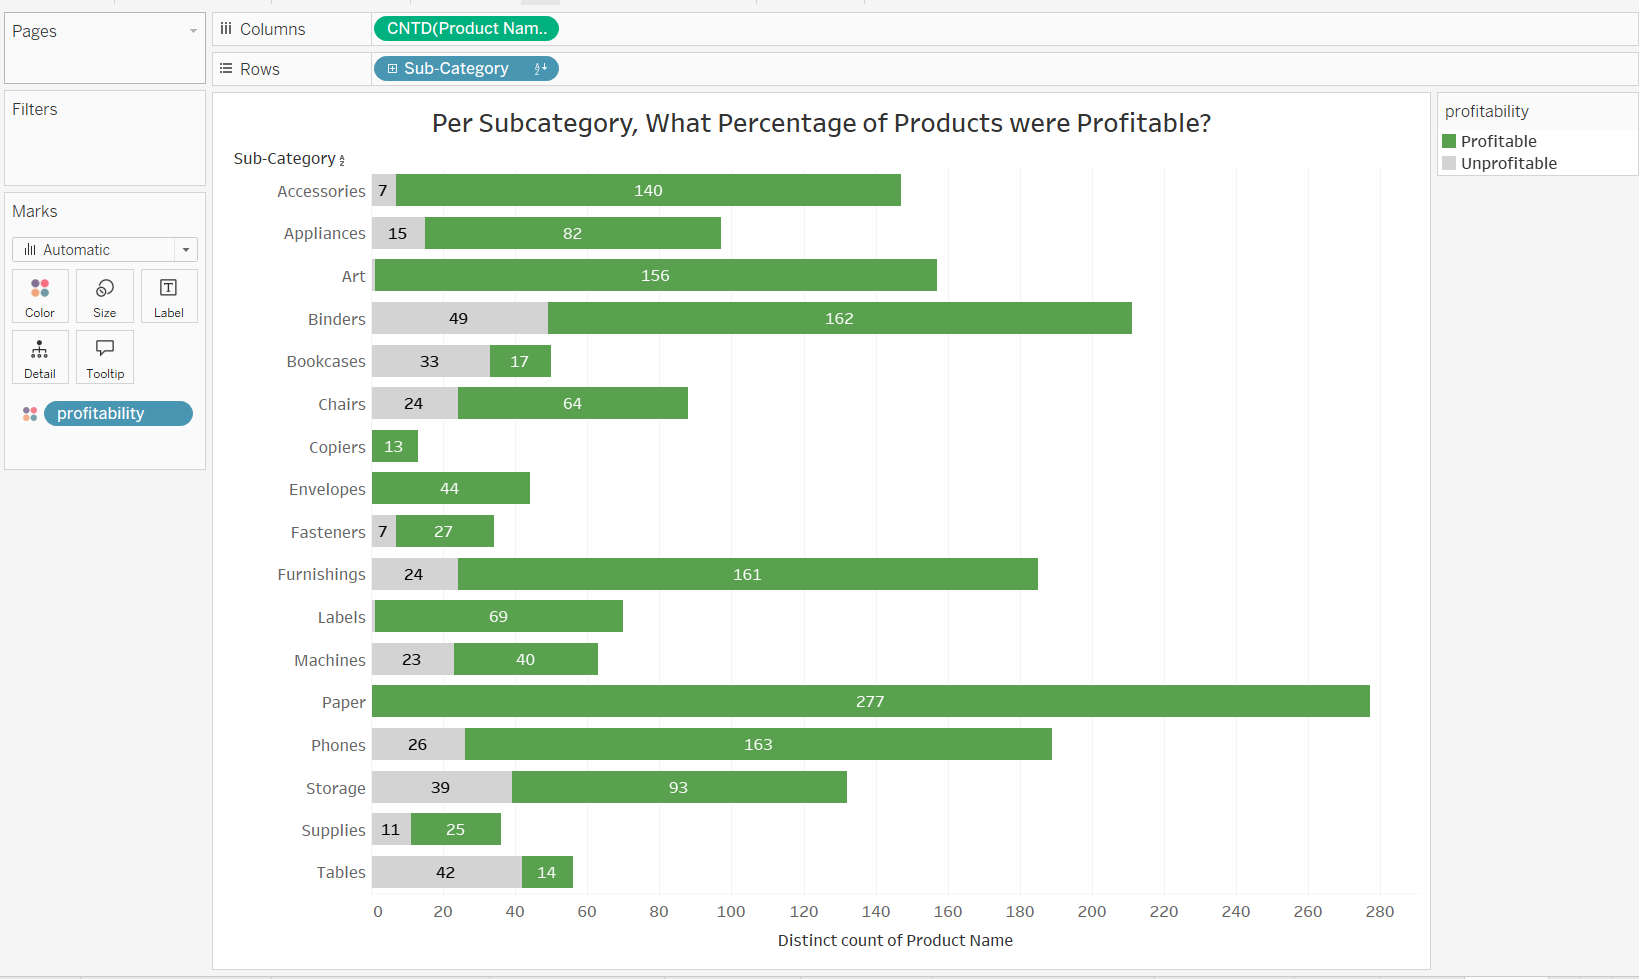
4) We can now place this field on Colour in the Marks card to show the profitability breakdown for each product.
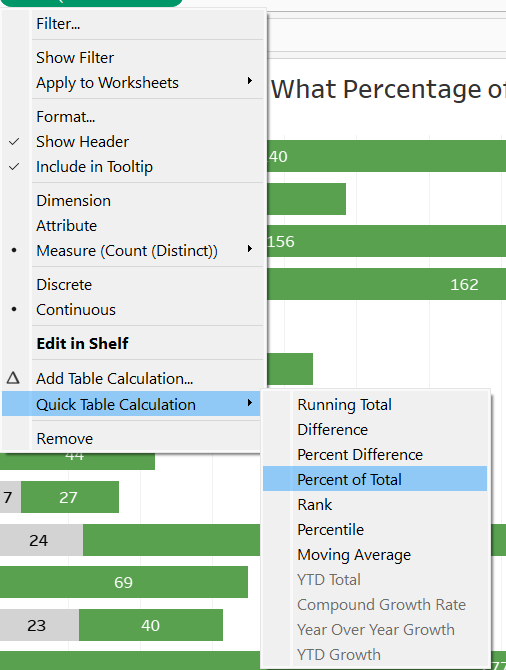
5) We now have the number of profitable and unprofitable products within each sub-category. To convert this into a percentage, we apply a table calculation. Right-click the count of products (the measure), choose Quick Table Calculation, and select Percent of Total.
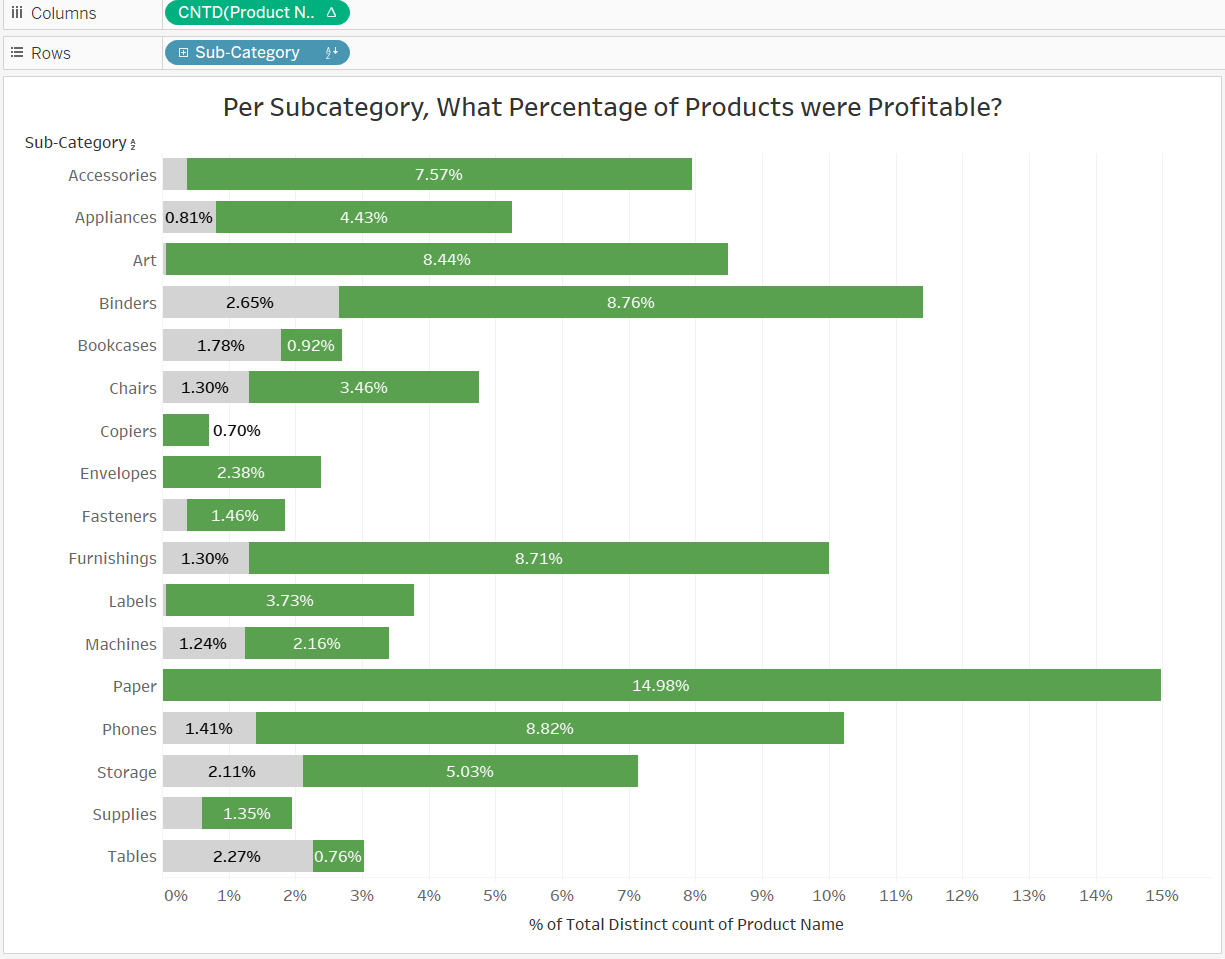
6) Because Percent of Total works across everything in the view, the values shown now represent each bar as a percentage of the entire dataset displayed, not just its sub-category. So we need to edit the table calculation to do this.

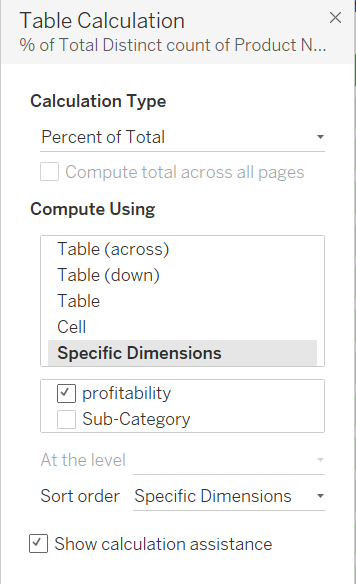
7) To get the correct percentage, the table calculation needs to run within each sub-category rather than across the whole view. This is why I switched the table calculation to Specific Dimensions. By ticking profitability and leaving Sub-Category unticked, the calculation resets for each sub-category. This means Tableau now calculates the percent of total within each sub-category instead of across all products in the dataset.
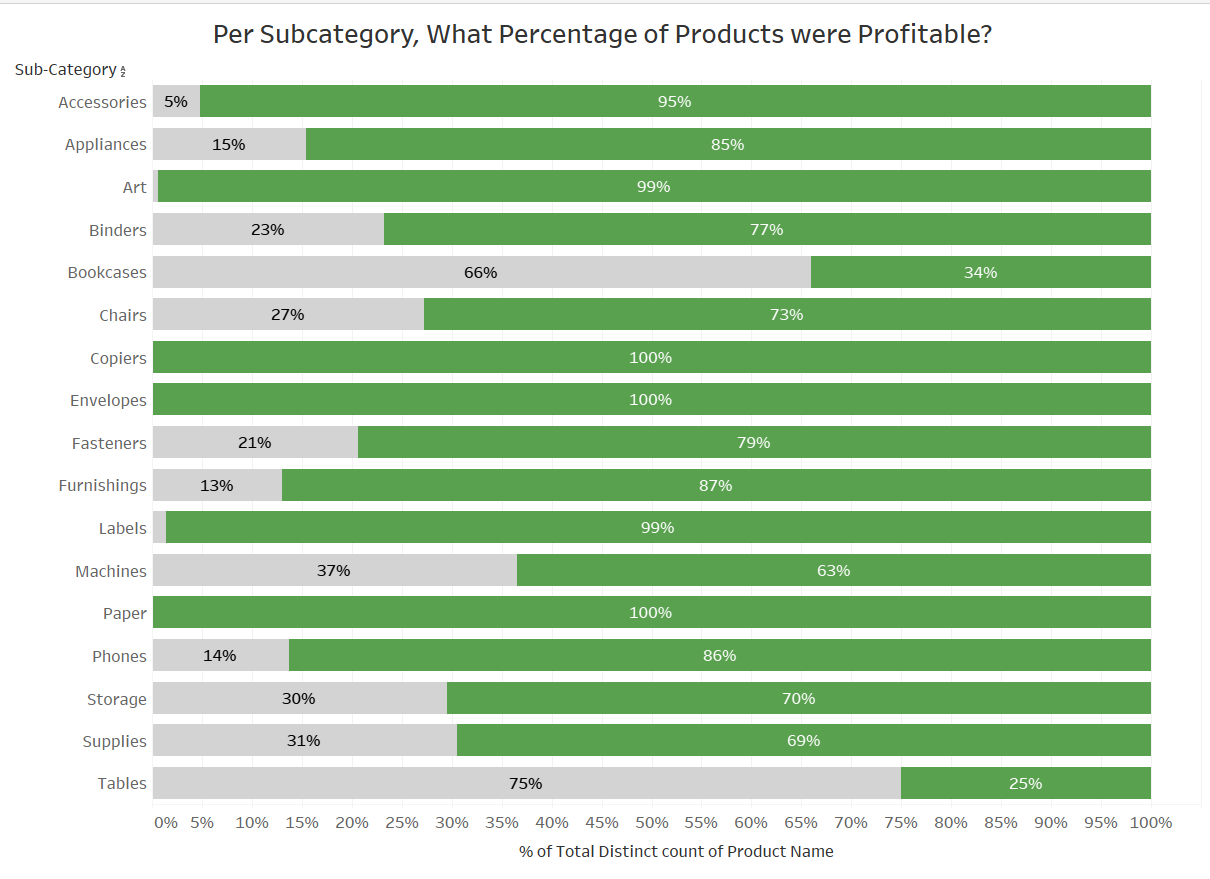
8) After some general formatting, this final view shows the percentage of products that were profitable within each sub category.
This example brings together a fixed LOD and a table calculation to answer a question that would be difficult to solve with one method alone. Understanding how these two tools work together makes it much easier to explore patterns in your data and build clearer, more flexible visuals. As I continue learning Tableau, I am realising how often these combinations appear in real projects, and I hope this walkthrough helps others feel more confident using them in their own analysis.