


or which tools you get to know as a data analyst
It's now week 9, and wow, what a journey! My daily learning list is huge. And of course, I never get everything done in a day, but I make a bit more progress each time I use a tool. For me, the key regarding "Data-Tools" isn't always about learning deep theory. It's mostly about practice. That means just opening the tool again, playing around for a bit, and even if it's just for five minutes, closing it and that's it. The trick is to not let the gap widen too much as the access or effort then becomes harder and harder.
After having learned R and Python as programming languages and exploring collaboration platforms like GitHub, I am now realizing that the key to data analysis does not lie in a single tool/programming language, but rather in the broad range of tools which are available.
During the last 9 weeks (especially in the first few weeks), the high number of tools and technologies felt totally overwhelming. Keep using each tool regularly so you will not fall behind. I'm also starting to see how everything fits together. The tools are more connected than I thought, with similar features, pros, and cons. The more I explore, the more it all starts to make sense, and I can see the big picture forming. Anyway, at the end of the day, we are service providers and what counts is what the customer needs.
Mastering Multiple Technologies to Stay Ahead
I use three regular ways to do this (the order indicates my prioritization):
- Open and use the tool / the technologie also it is just for fun (preferably on a daily basis)
- Use the opportunities for practical exercises based on the various Weekly Challenges in the different communities
- makeovermonday.co.uk (Practicing Tableau by (re-)builing dashboards within a short time limit)
- preppindata.com/challenges (Practicing Tableau by building Prep-Flows for data cleaning and transformation)
- workout-wednesday.com (Practicing PowerBI by (re-)builing dashboards within a short time limit)
- community.alteryx.com/t5/Weekly-Challenges/bd-p/weeklychallenge (Practicing Alteryx by building Workflows for data cleaning and transformation)
- Udemy (www.udemy.com) There are many courses on Udemy, actually on every possible tool and technology that is important and helpful for data analysts. The good thing is that you can schedule fixed learning times or also set e-mail reminders. This allows you to create your very own learning content and you can stay up to date (even if it's only 10 minutes a day).
Tools and Technologies
How I understand the distinction between both: Tools refer to specific applications or software for distinct tasks within the data world. They are instrumental in executing precise functions efficiently. For example, Excel serves as a tool for spreadsheet management, Tableau facilitates data visualization, and Alteryx empowers users with advanced analytics capabilities.
On the other hand, technologies encompass a broader variety, constituting the foundational frameworks, platforms, systems, programming languages, and methodologies that underpin the development and management of tools and applications. In the data sphere, technologies provide the infrastructure necessary for data processing, storage, analysis, and interpretation. Notable examples include cloud computing platforms, database management systems and programming languages like Python and R.
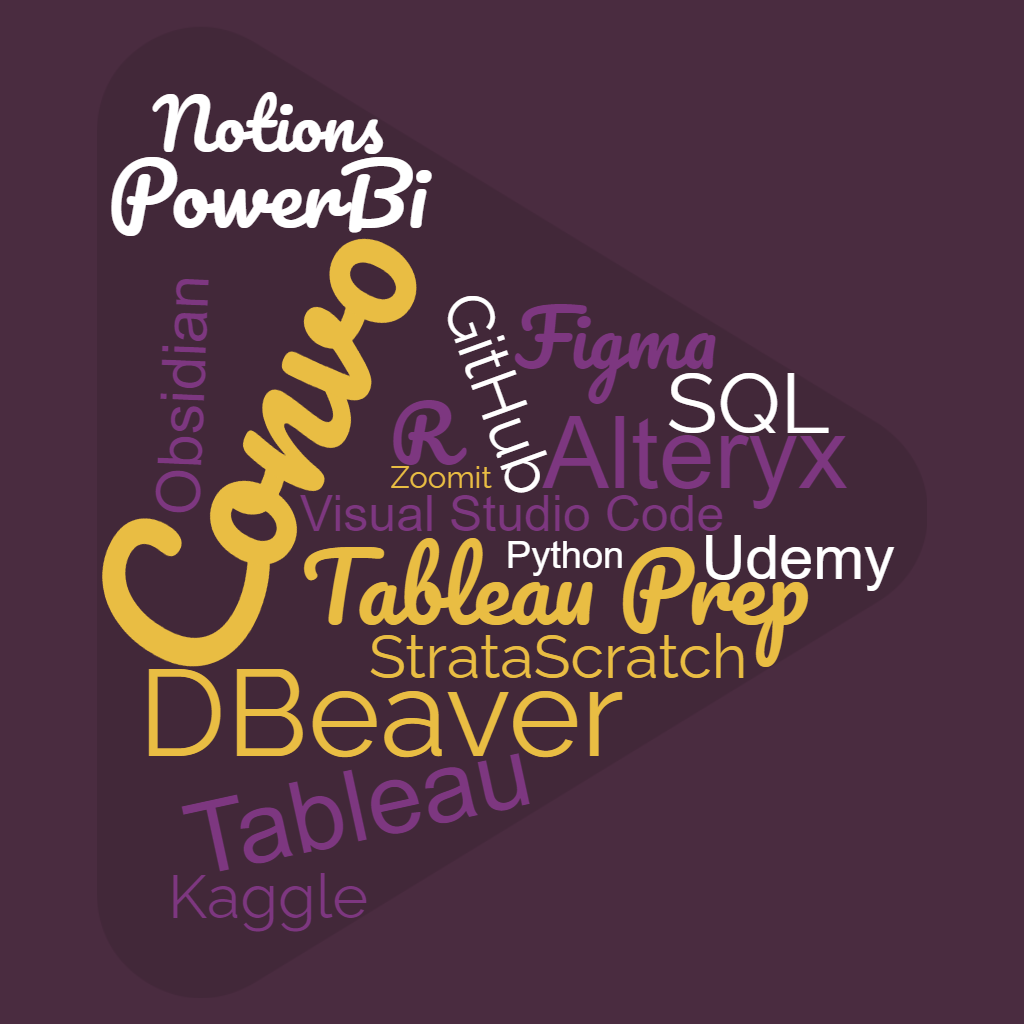
Interesting Tools/Technologies
Convo, GitHub, DBeaver, Visual Studio Code, Alteryx, Tableau, Tableau Prep, PowerBi, SQL, R, Python, Figma, Notions, Obsidian, Udemy, StrataScratch, Kaggle, Zoomit,