


Are you also annoyed when building a dashboard or chart and using metrics that appear on multiple sheets, and you have to adjust the desired formatting on each sheet every time?
It takes a lot of time and requires many repetitive clicks.
If this is the case for you, you’re probably formatting the metrics like this:
Either you right-click on the respective axis or directly on the metric values in the row or column container.
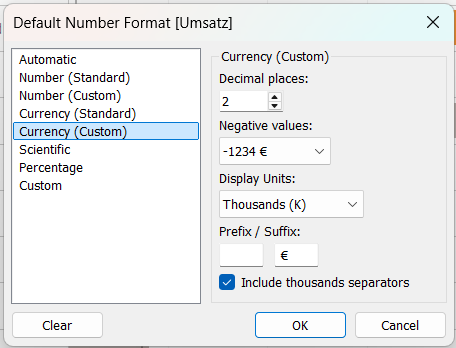
But fortunately, there’s a way in Tableau to set default properties for data fields. If consistent formatting across all graphs is desired, it’s worth adjusting the default properties in advance. For example, you have the option of always displaying the profit with two decimal places and in thousands (K).
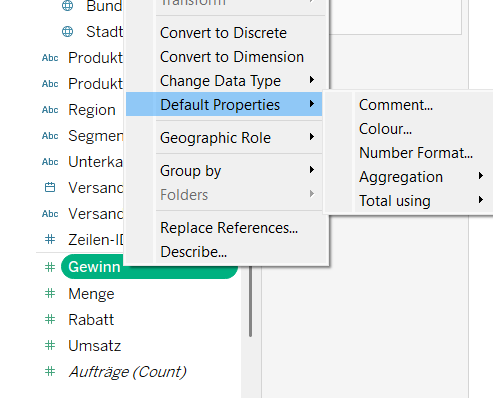
The process is similar, but now you’ll be working with the data fields from the Data pane. By right-clicking on the metric you want to format, you can select the option Default Properties, and for the example mentioned above, choose Number Format. Then, simply select the desired formatting. When you build graphs after this step and use this metric, the values will appear in the pre-set format.
But it’s not just for numbers, other formats can also be set in advance. Another example would be setting the color so that you can avoid having to adjust the color legend every time.