In Tableau you can use parameter filters to aggregate dates, in this blog we will explore how.
We will use the superstore data set and create a simple line chart showing sales across time.
First we set up the parameter:
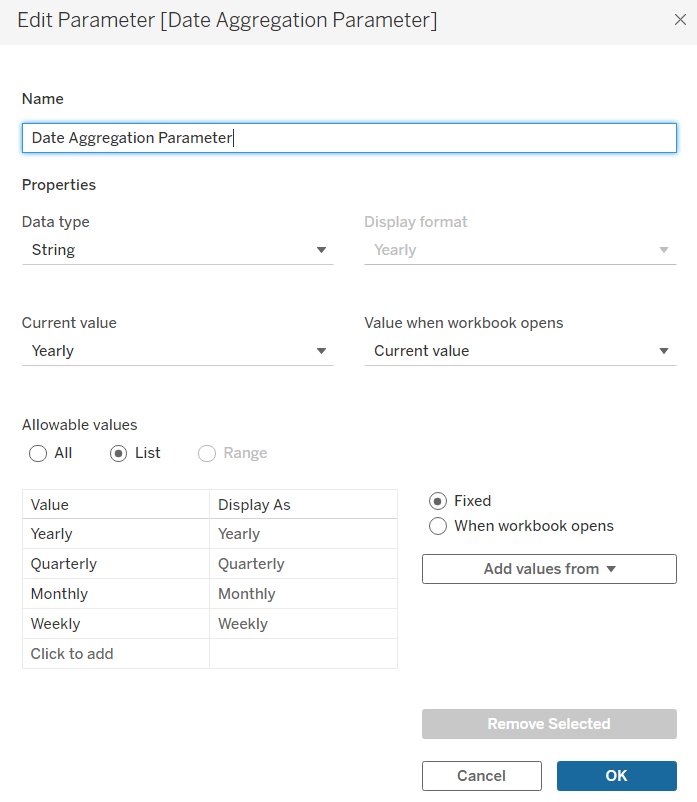
We set it to data type "string" and set the value to the level of aggregation we want to allow the user to be able to aggregate to.
In this case we will include Yearly, Quarterly, Monthly, and Weekly.
After setting up the parameter we will set up the calculation:
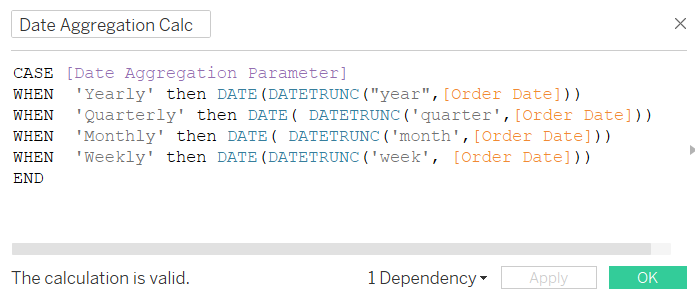
This calculation allows us to dynamically aggregate the "Order Date" field based on the selected option in the "Date Aggregation Parameter."
The "Date Aggregation Parameter" is the parameter we created earlier and it allows us to select different levels of date aggregation, such as "Yearly," "Quarterly," "Monthly," or "Weekly." Depending on the selected option, the calculation will return the corresponding aggregated date based on the "Order Date" field.
WHEN 'Yearly' then DATE(DATETRUNC("year", [Order Date])):
If the "Date Aggregation Parameter" is set to 'Yearly,' the calculation will truncate the "Order Date" to the year level using DATETRUNC("year", [Order Date]), and then return the result as a date using DATE(). This effectively aggregates the data by year.
Similarly, the calculation follows a similar structure for 'Quarterly,' 'Monthly,' and 'Weekly' with the appropriate 'DATETRUNC' function for each level.
Once the parameter is set and the calculation field is created bring the date field into the columns and select exact date.
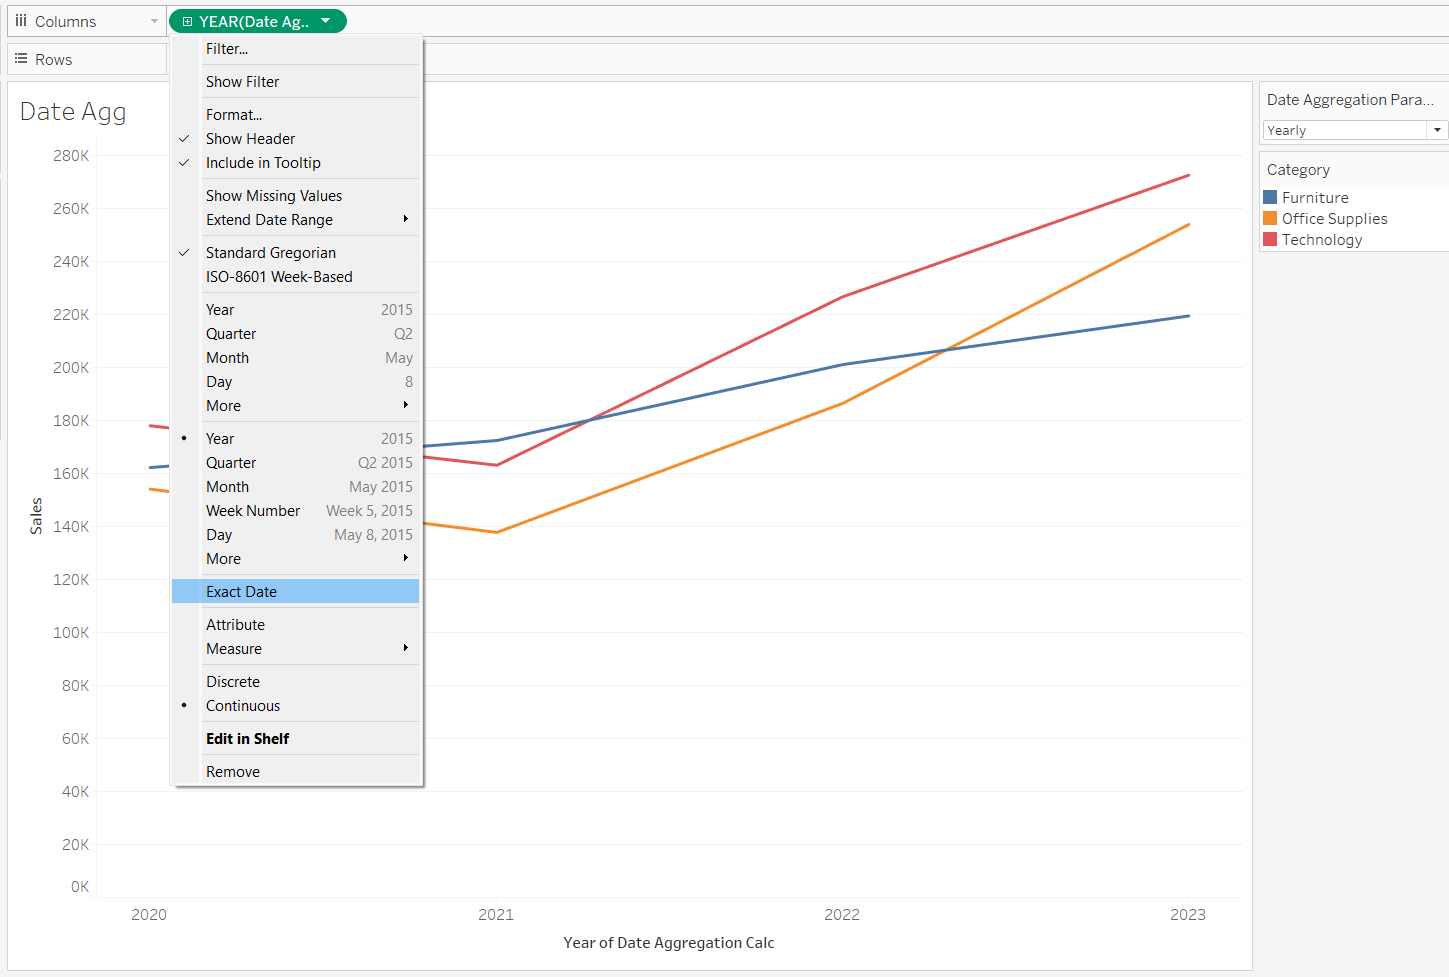
Now you should be able to change the parameter to the desired aggregation and the field will reflect the aggregation that is selected.