


Today we were given the task to use the Rick and Morty API in order to retrieve data and create a dashboard.
The API seems to be well documented, once I noticed this I went straight to Postman and started make calls to the API to see what kind of data it would return.
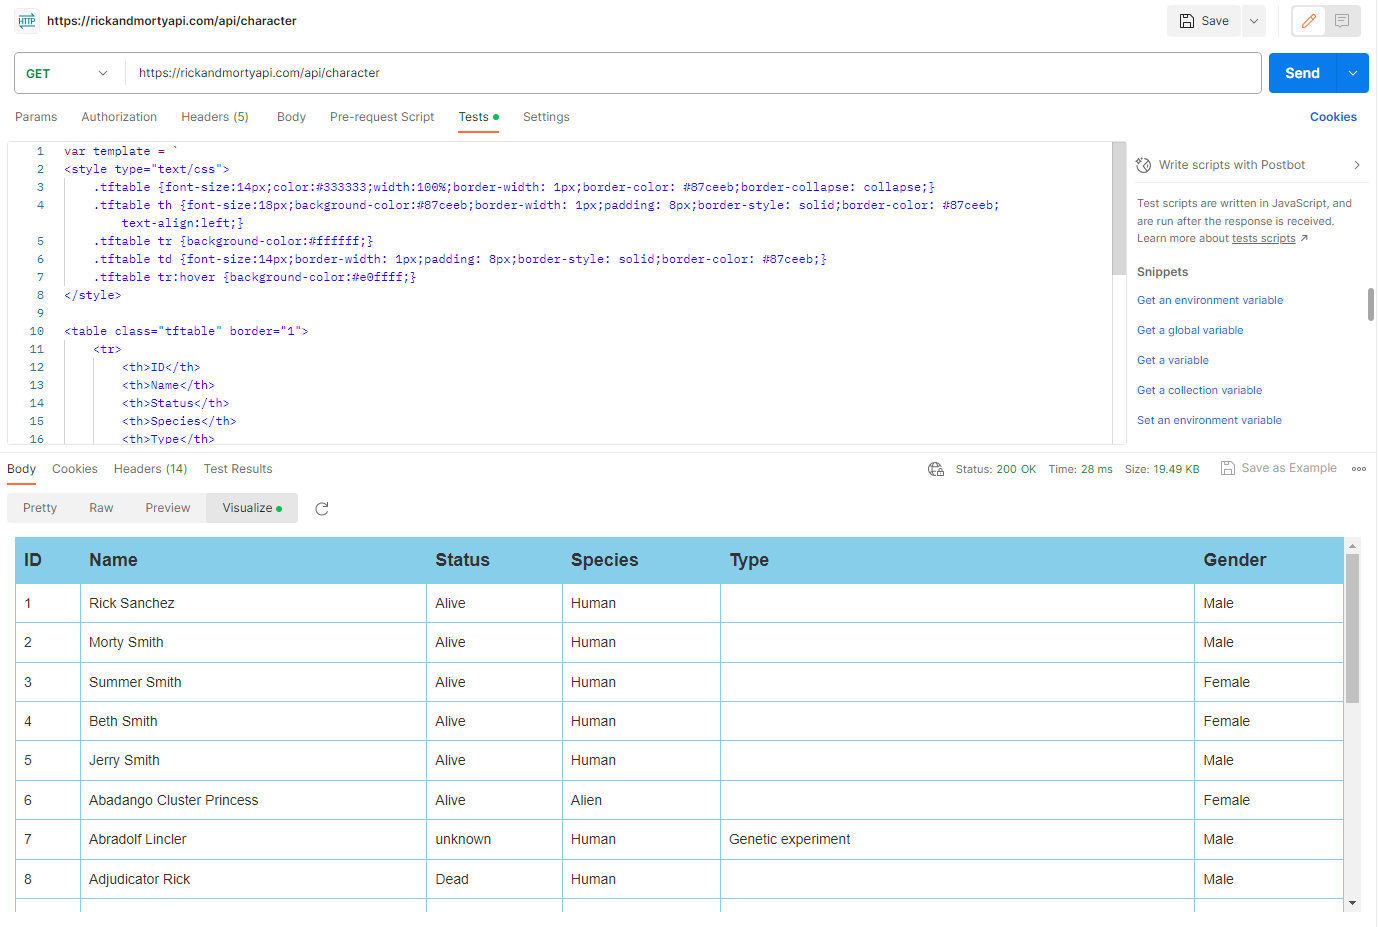
While in Postman I started to figure out how the data was structured and connected.
Something important that I noticed is that when calling the API to get the list of episodes it returns a set number of episodes, it doesn't list out all the episodes at once; this is something that I will need to take into consideration when in Alteryx.
Once in Alteryx, I first set up the regex so that the output of the first API call is clean and usable in Tableau. Then I found the last page of the API call and created a specific URL for each page in between. This way it gives me the results from all the API calls at once.
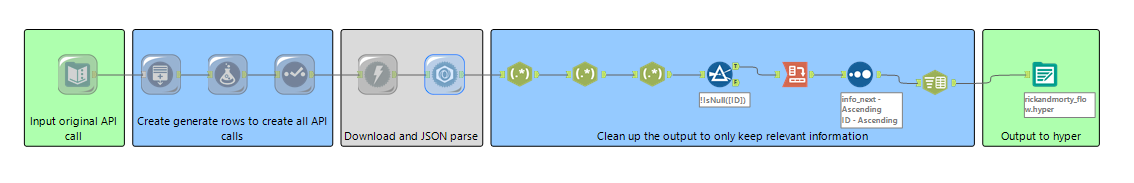
The process to clean up the JSON was straight forward. I structured the data to be one row per character at first, however I encountered a problem with this since the episodes that the character appeared were all concatenated in one row it caused Alteryx to truncate some of the cells since it exceeded the size allowed for strings. To go around this I used regex to parse out the episode number only and then I was able to capture all the episodes in one cell. After doing this I pivoted the data so that each row was an episode grouped by the character.
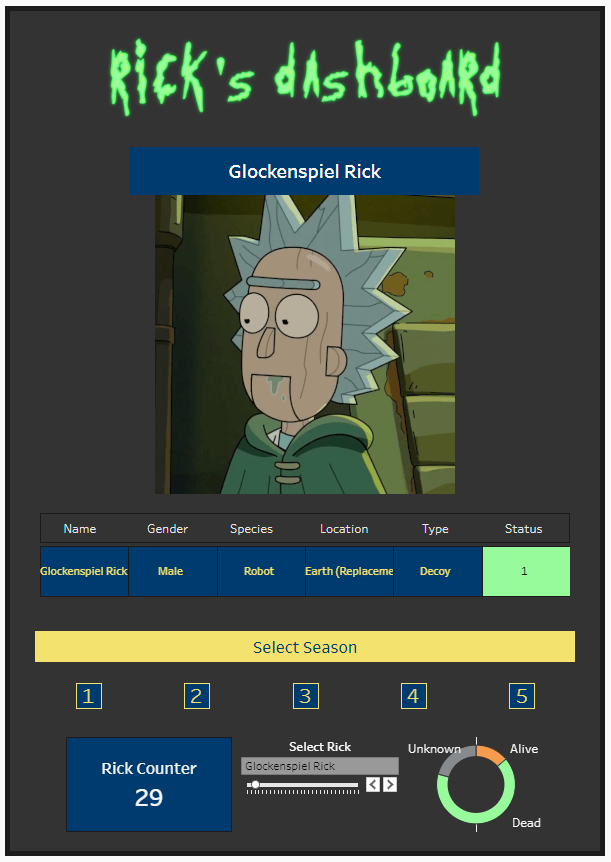
My original idea was to create a character summary of Rick and Morty, which would allow the user to look through all the different iterations of Rick and Morty that have appeared throughout the seasons.
What I was able to complete was Rick's portion of this idea.
The final output turned out like this:
Note: If you are working with similar datasets and having issues with the image URL might not acting as expected in Tableau Desktop, the problem might resolve itself once uploaded to tableau public, this is something that I ran into when working on this specific dasboard. Tableau limits the number of image allowed to load for some reason and the results are different in desktop compared to Tableau public.
Overall this project was a nice recap of working with API's within Alteryx.