


The final day of Dashboard Week has arrived, marking the end of an enriching training journey for us at DSNY4. It was a day tinted with somberness, beginning with a relentless downpour that brought public transportation in NYC to a halt. As a result, most of the team struggled to reach the office, arriving much later than usual.
The inclement weather also forced us to cancel our planned celebrations for the day, or at least most of them. Those still in the office accompanied us during our last presentation of Dashboard Week. Although our team was physically divided, with some presenting from home and others in the office, there was an undeniable sense of unified accomplishment. It marked the conclusion of a four-month journey of learning and working together on projects as a eight person team.
As we looked towards a slightly uncertain future, the closing chapter of the past months couldn't help but draw us into reflection. This introspection was particularly poignant as we tidied up our workspace, making way for DSNY6. It's time for us to move on, but the memories and lessons from these four months will stay with us, guiding us as we embrace new challenges and opportunities.
The dataset provided was the same final interview dashboard that DSNY5 worked on for their interviews. It was NYC Health: School Cafeteria Violation data, The data was already cleaned and ready to use, once the task was announced I went straight to work, looking through the data, thinking about insights possible to derive with what was given. I noticed there was geographical information throughout the dataset which nudged me to go the direction of using dynamic zone visibility to create interactive maps within Tableau. I spent the early parts of the day doing that after which I looked to create a view that would allow the user to take a look at any violations found at a particular school at any of the inspections.
I achieved this by including a table with the inspection details allowing the user to get a detailed view of a particular school of their choosing.
This was the final output:
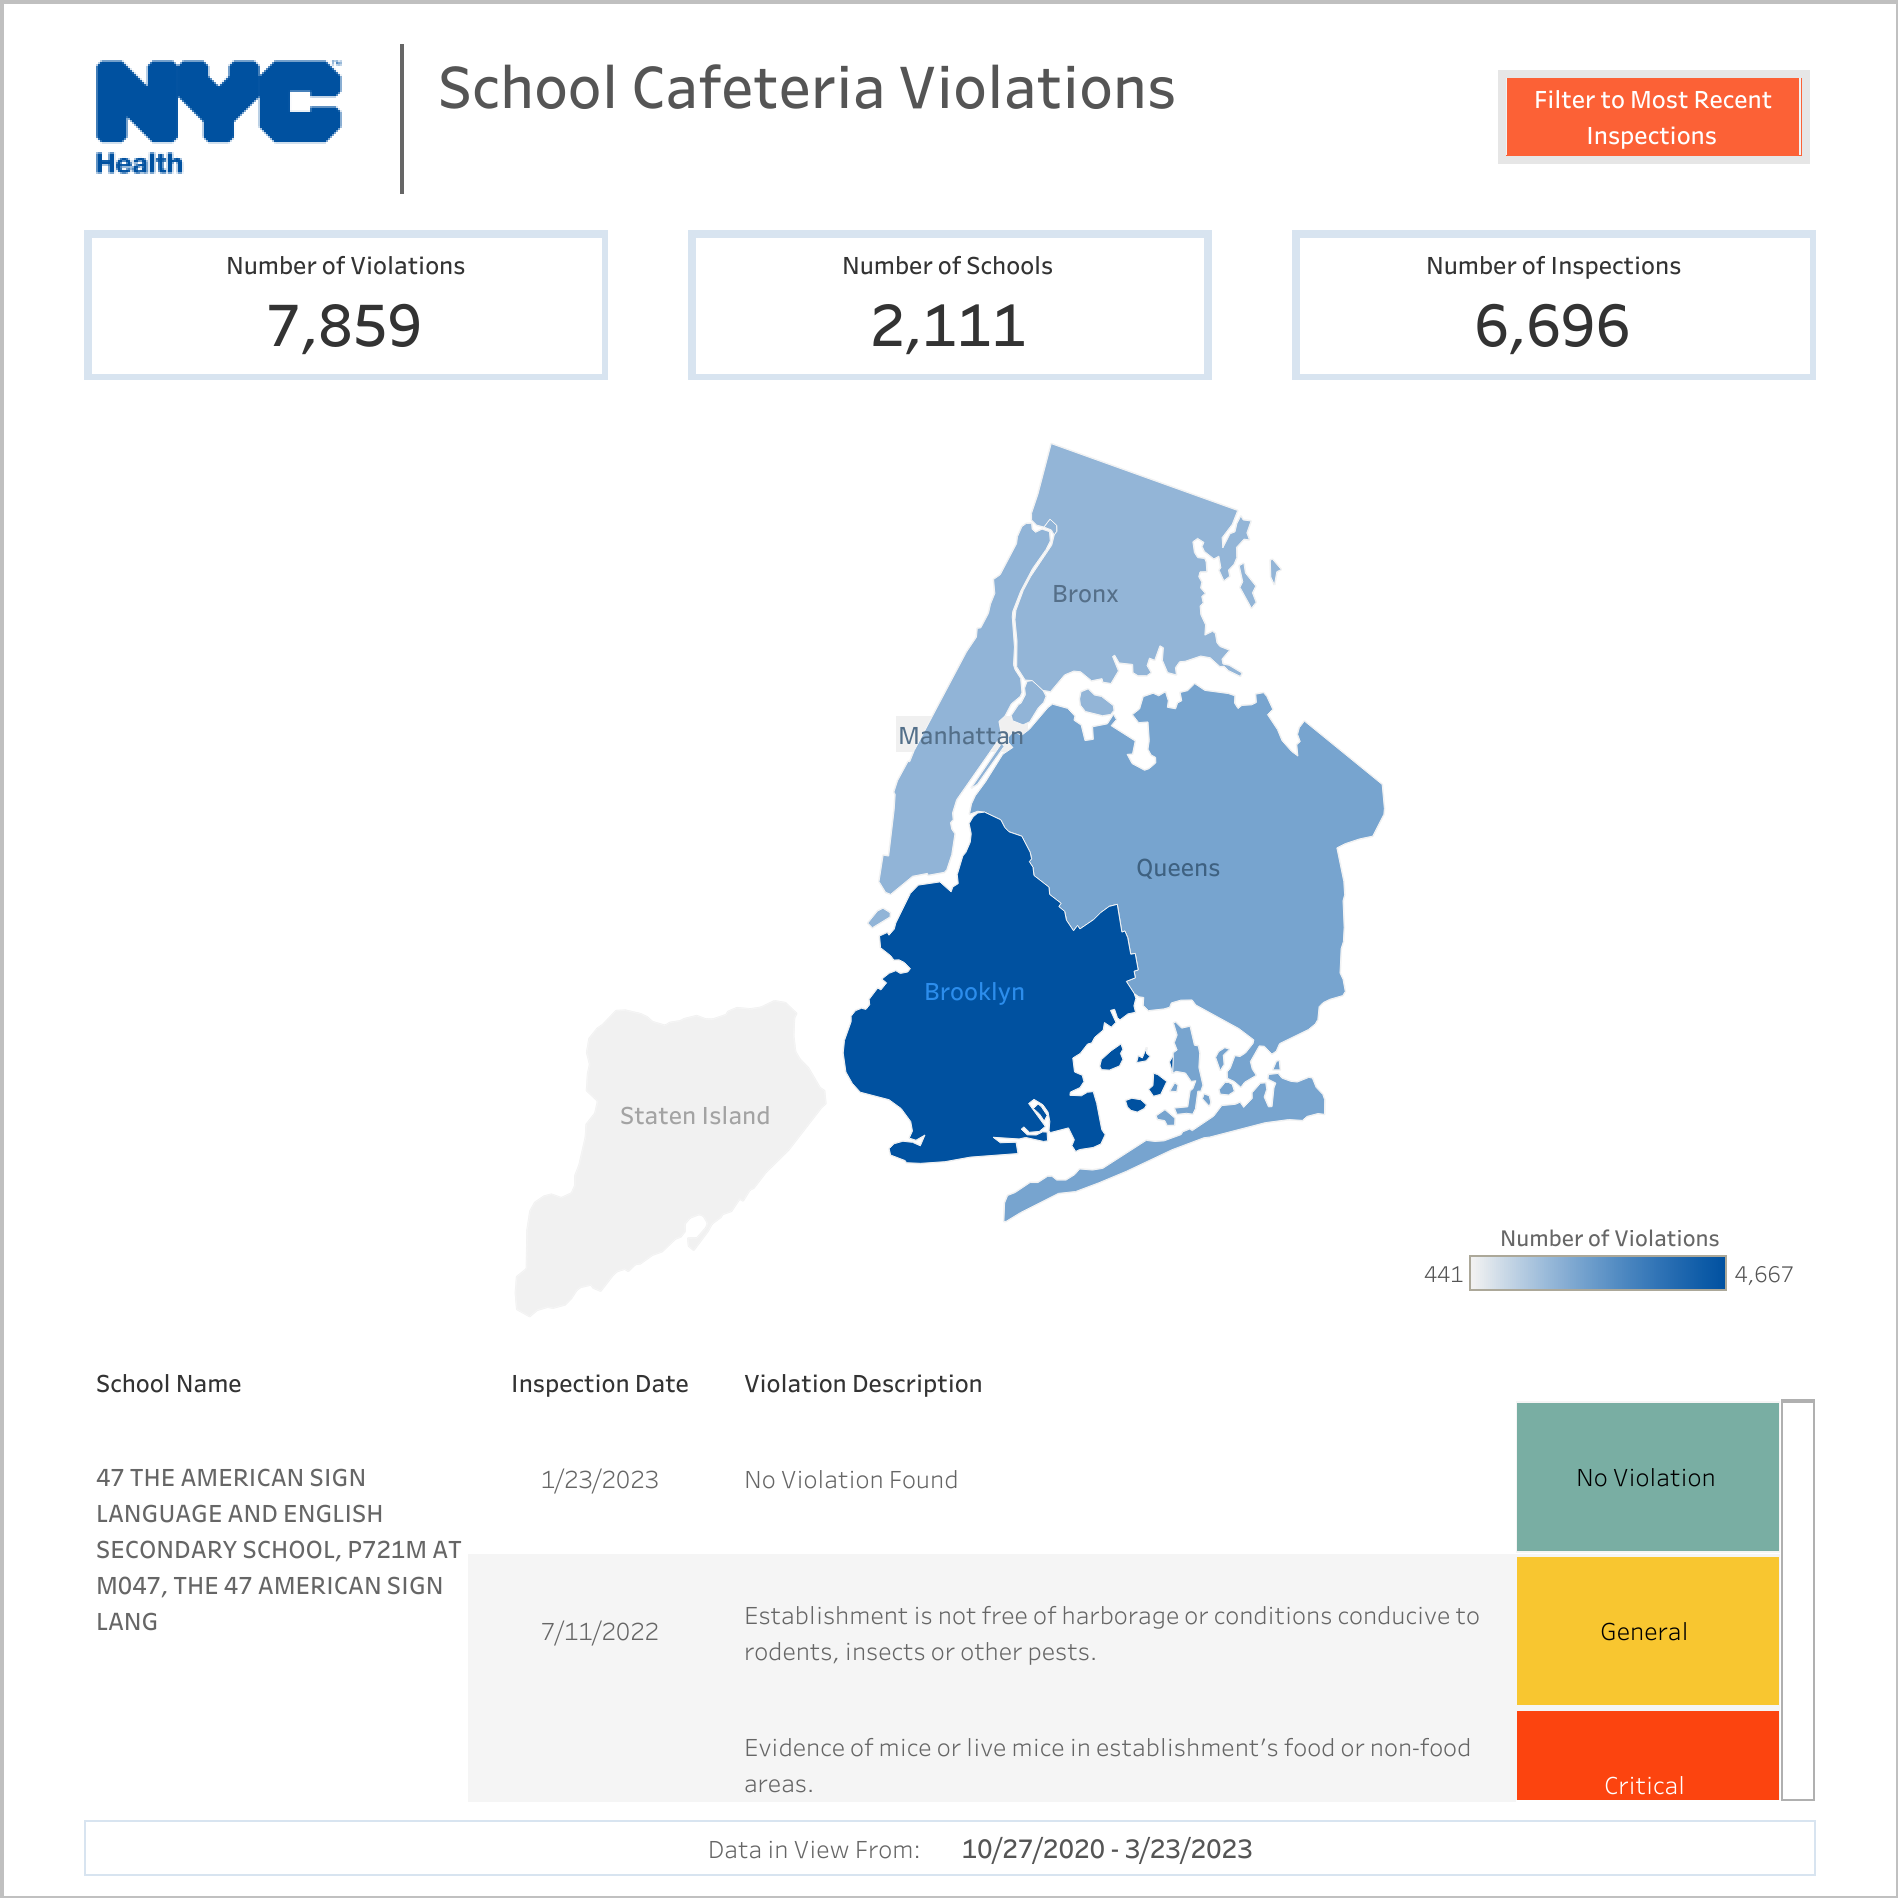
I enjoyed working on this dashboard, the final outcome gives an overview using the BANS as well as allows the users to take a deeper look at a granularity of their choosing. With more time I would have liked to include some sort of trend analysis as well as include a flag for recurring violations.
Another approach that could have been taken with this was to analyze the most common violation, when and where the inspections are taking place etc. This could be an exciting expansion to this dashboard. Maybe a button that allows the users to shift their view to a comprehensive report, in this report the user would fine the additional insights mentioned.