In this blog, we will explore how you can create a pixel map which we can use in Tableau.
Step 1:
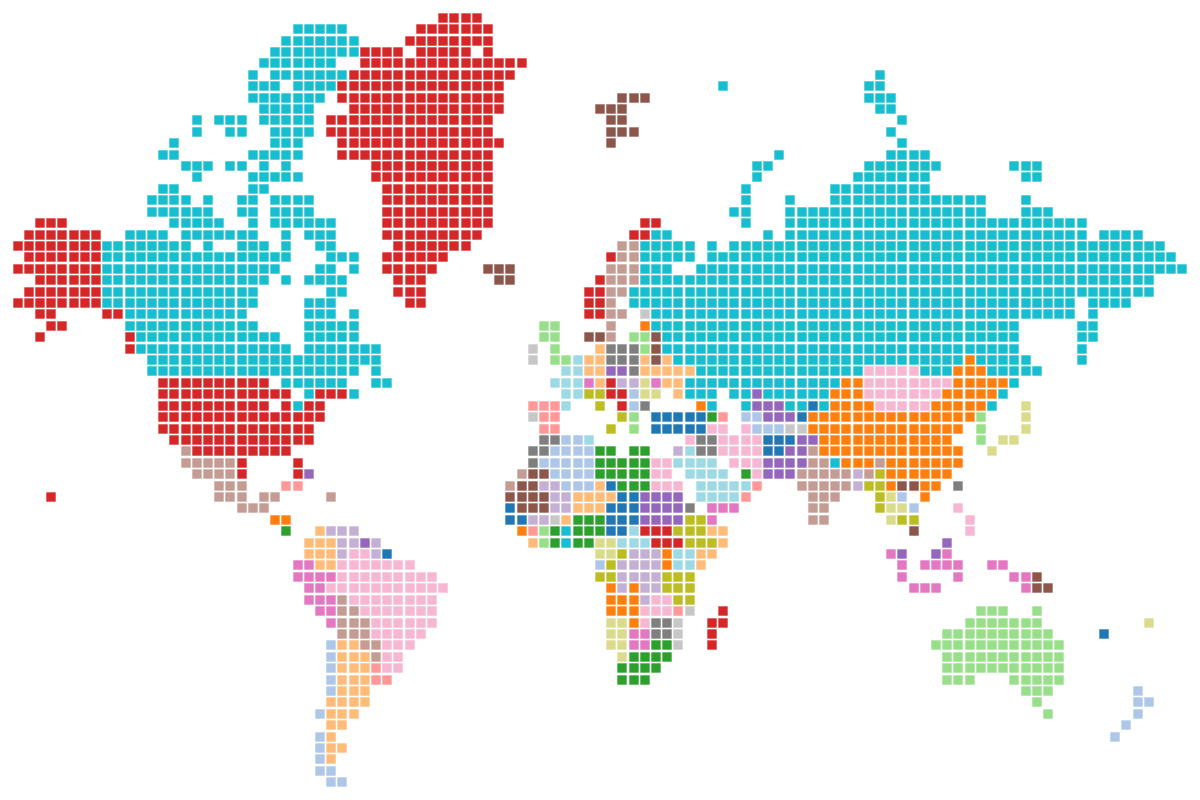
Start by navigating to the website called "https://pixelmap.amcharts.com/".
Next, customize the settings of your pixel map as per your preference. You are able to choose specific regions as well as the map projection.
While choosing the size and distance between the pixels, keep in mind that if you make the pixels too small or too close to each other, some countries might not be visible or recognizable. So, find the right balance for the pixel size and spacing to ensure clarity and visibility for your requirements.
Step 2:
Once you have modified the map to your preference download the HTML file.
It should look something like this:
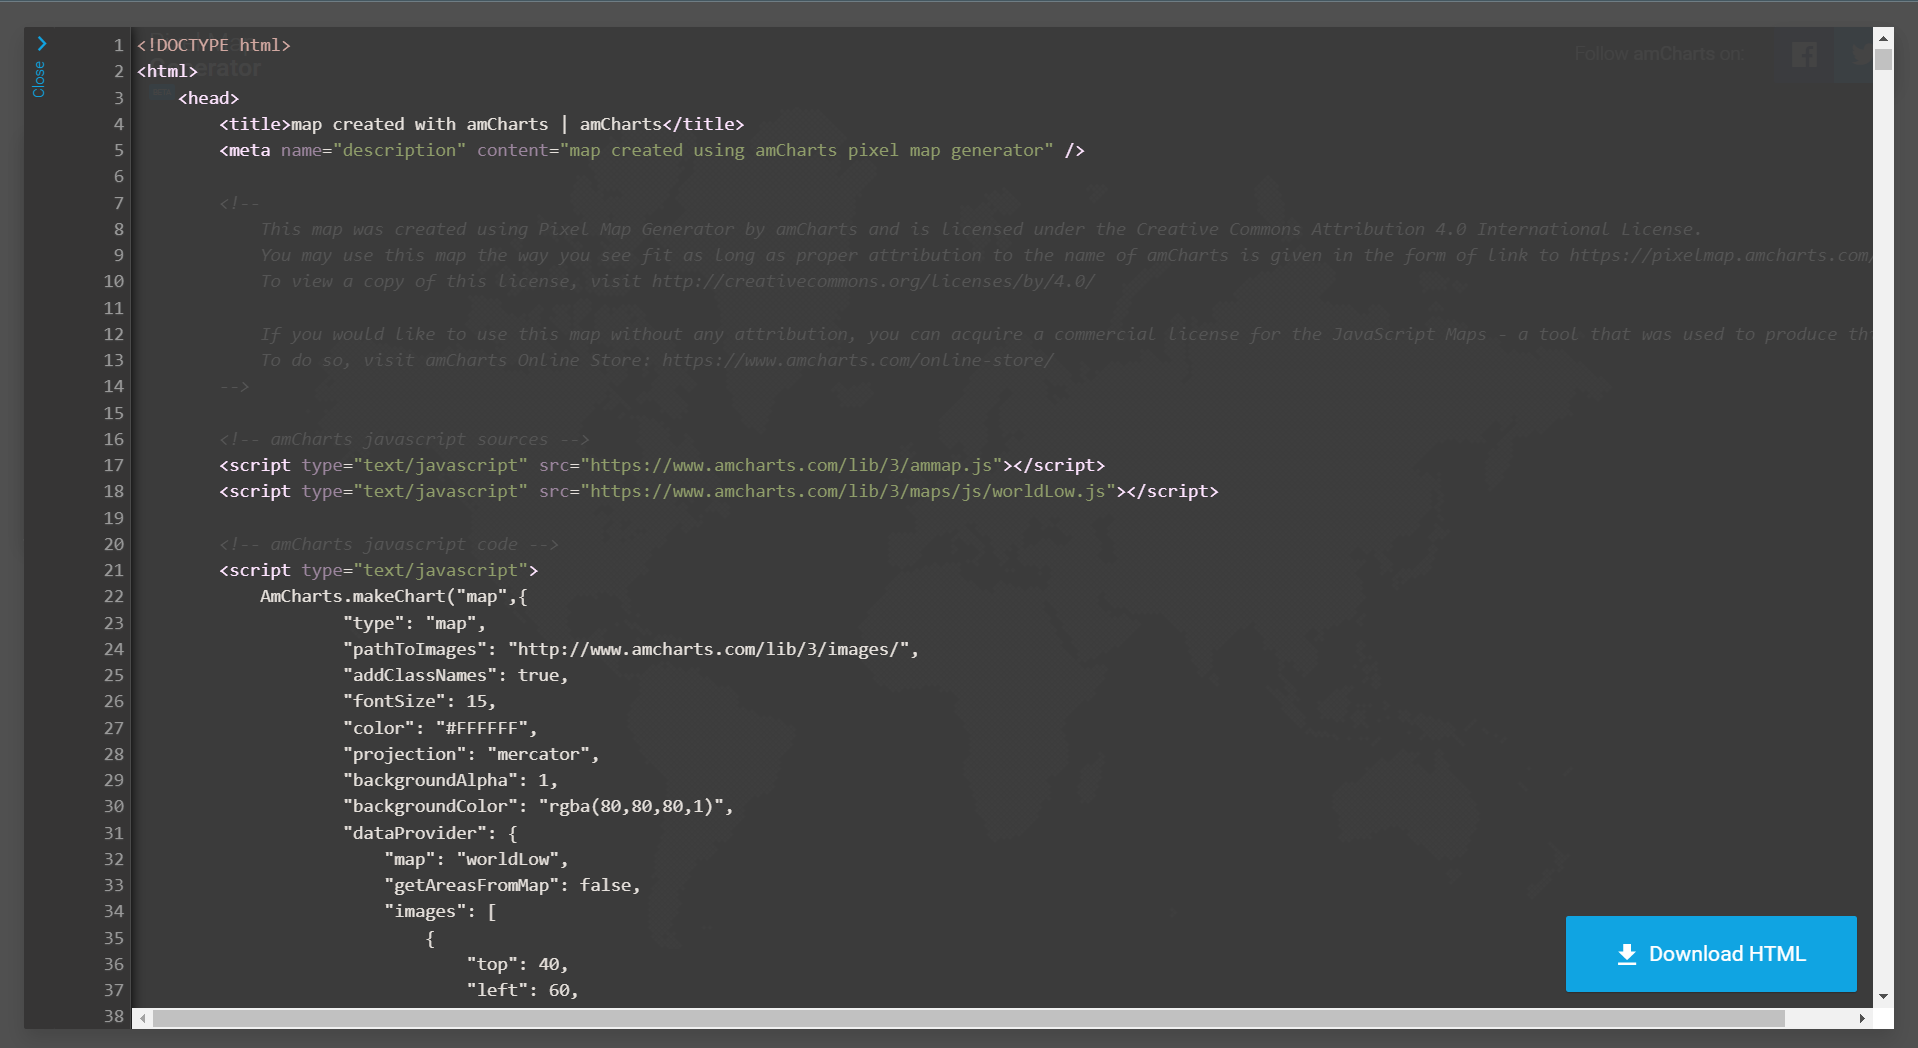
We only need the images array from this HTML file.
So locate the images array and copy it, from the beginning to the end of the array.
Make sure you are copying the entire array. We will save it as a JSON file next.
Step 3:
Once we have the image array copied you want to open up your preferred text editing tool and save it as a JSON file. The array should look like this.
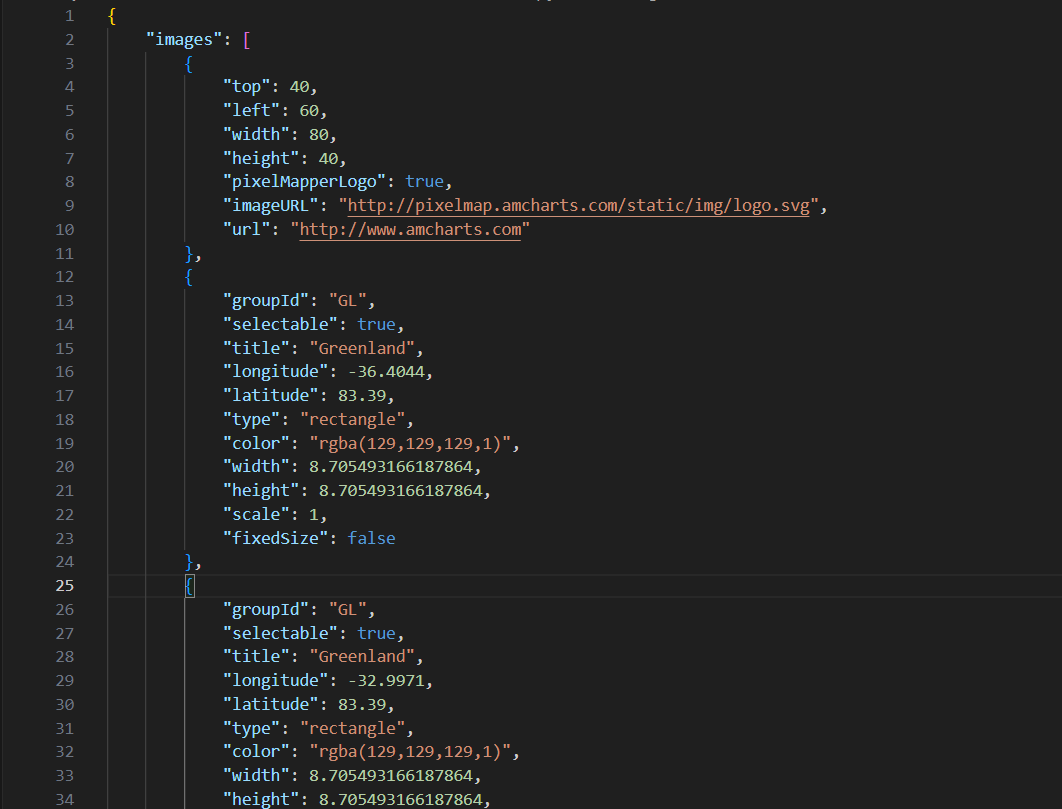
Notice that I encapsulated the image array between curly braces.
I have it opened in VSCode in this example.
Step 4:
Once we have the JSON file saved we will then have to convert it to XLSX.
To do so I used this online tool.
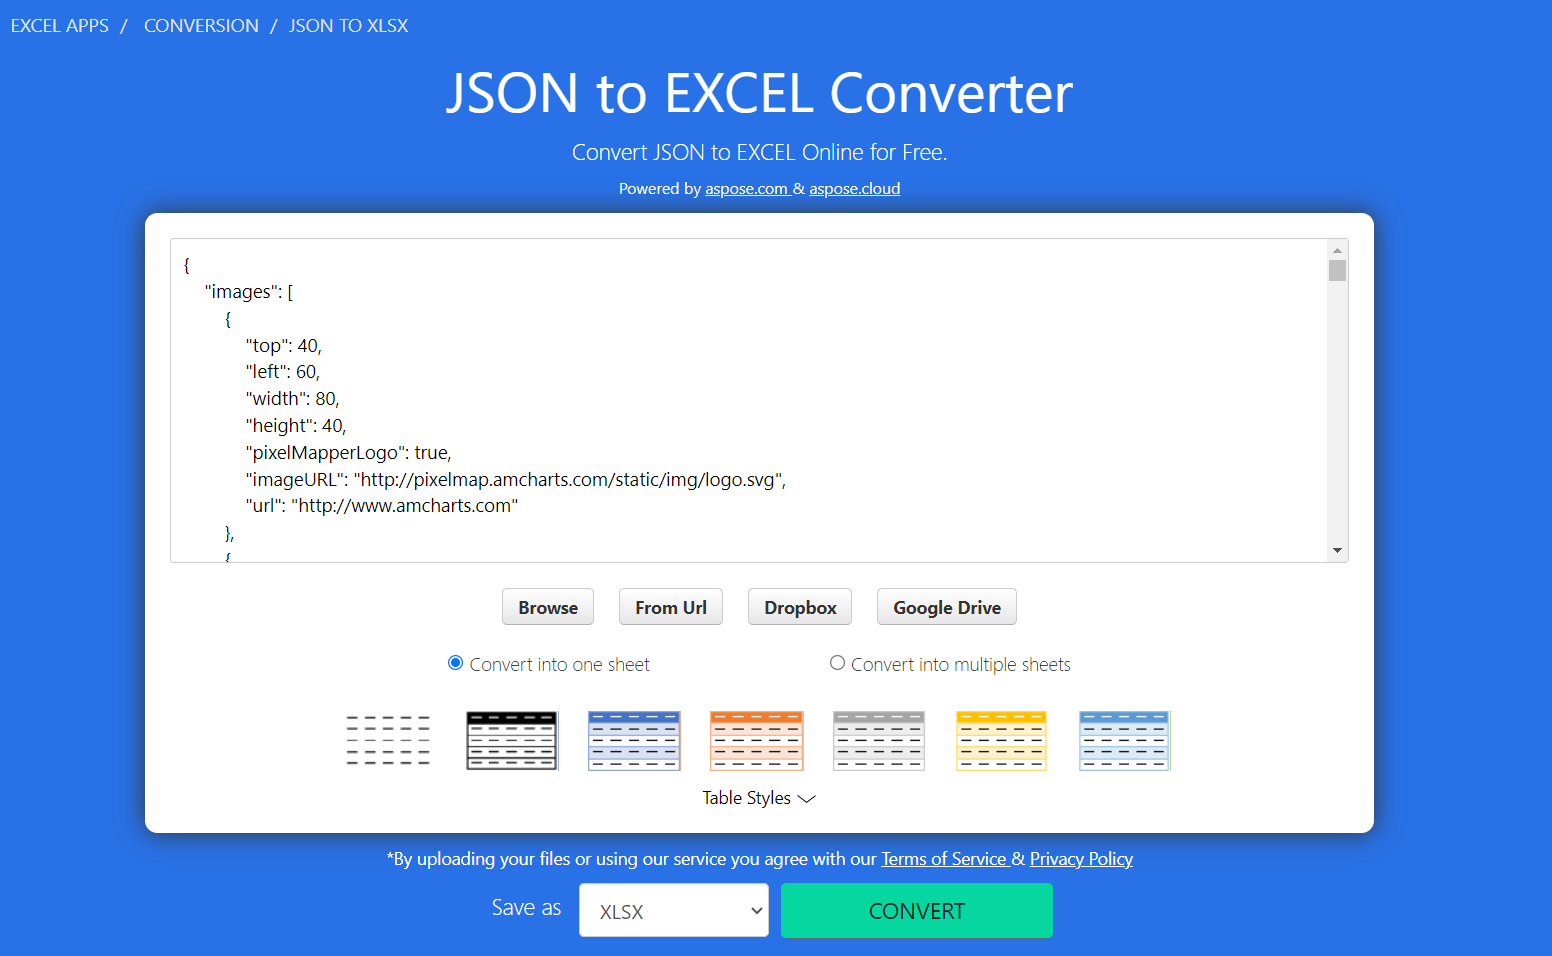
Upload the JSON file and hit convert and download.
Step 5:
After converting to XLSX from JSON we will need to clean up the file in order for it to be useable in Tableau.
To do so we will open up Alteryx.
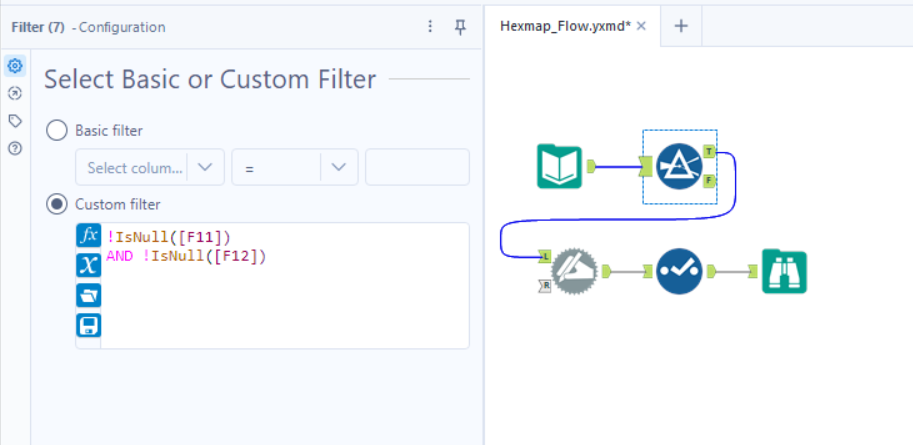
Once we have Alteryx open and the Excel file inputted we will use the formula tool to get rid of the nulls as seen above.
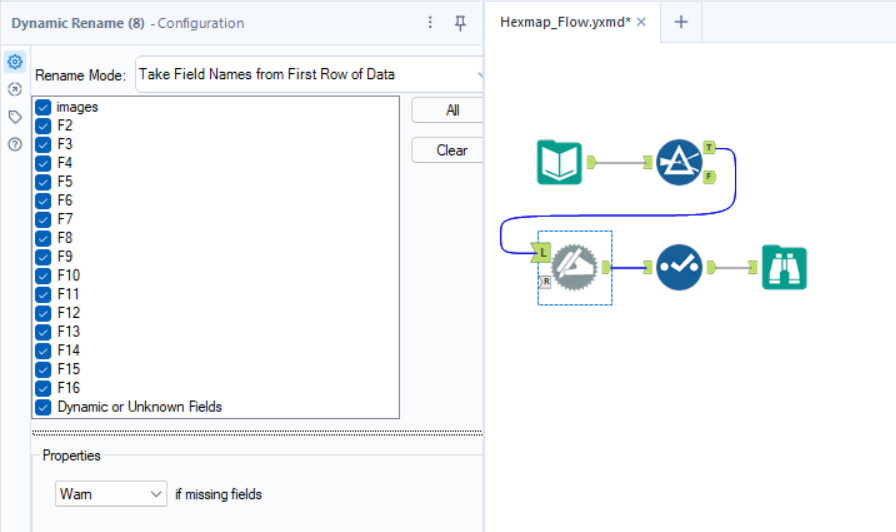
Then we will use the dynamic rename tool to rename the columns based on the first row.
Once that is complete we will use the select tool in order to remove all the fields that is not necessary. Then we will use the output tool and export our freshly cleaned Excel file.
Step 6:
We can now use this in Tableau.
Open Tableau and connect to the Excel file that was just created.
Once you have imported the dataset open up a brand new sheet.
We are almost there!
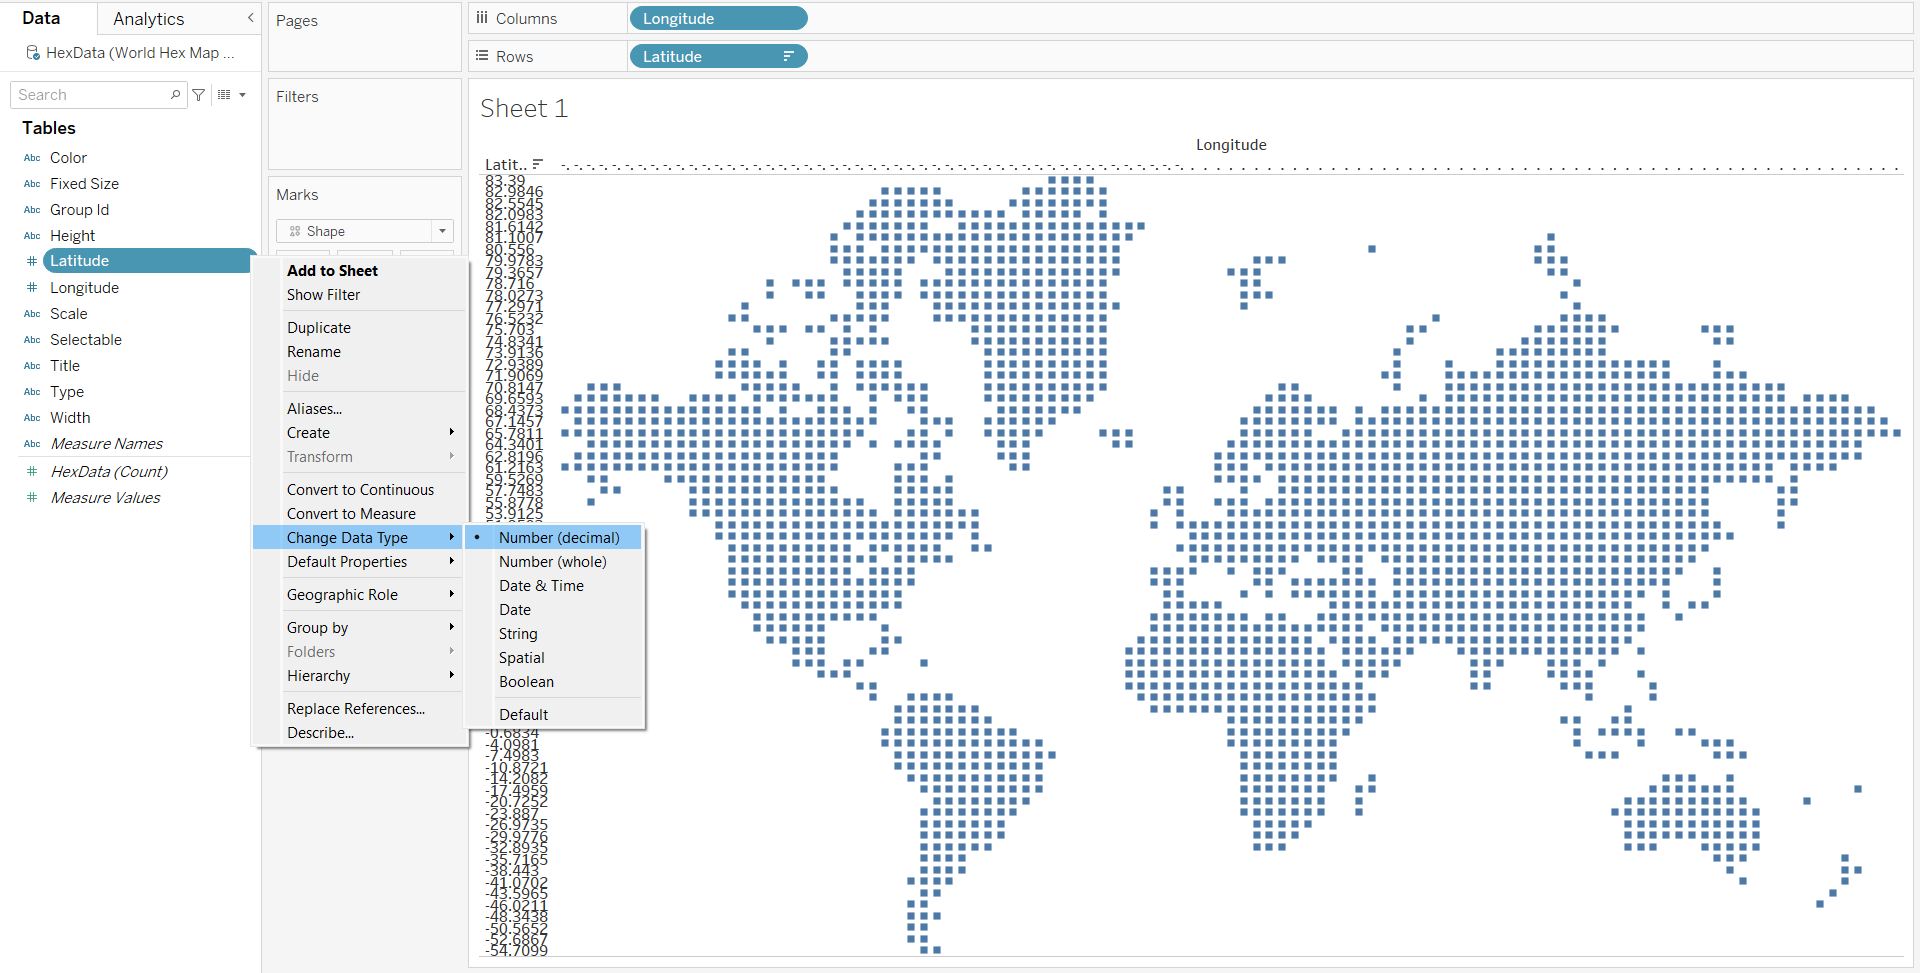
As you can see we have Latitude and Longitude fields which were created, before we can use them though we have to change it from the data type of string to Number (decimal).
Bring the Longitude field to columns and the Latitude to rows.
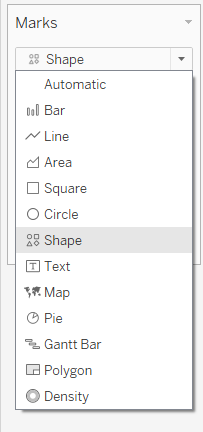
Then change the mark type to shape and choose the filled in square as the shape.
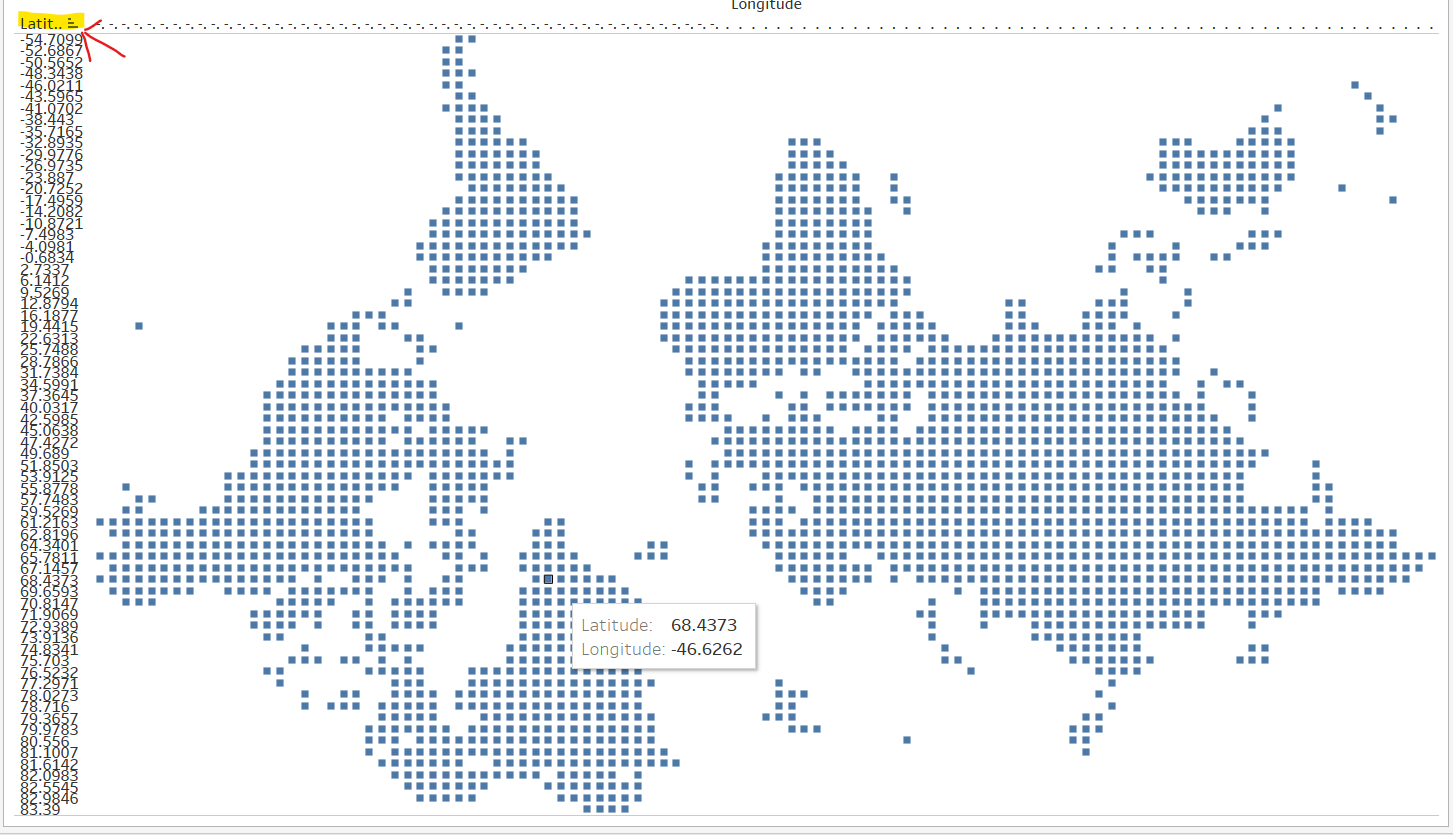
Note, if your map is upside down sort the Latitude field and it should change to be right-side up.
After which you can customize it how you wish.