


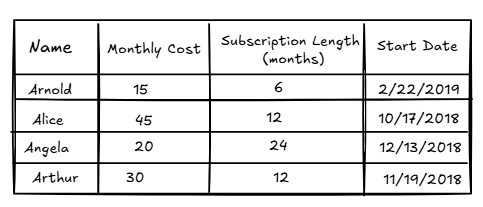
Suppose we have a dataset with four magazine subscribers, each of whom has a monthly subscription cost, a defined subscription length in months, and a start date:
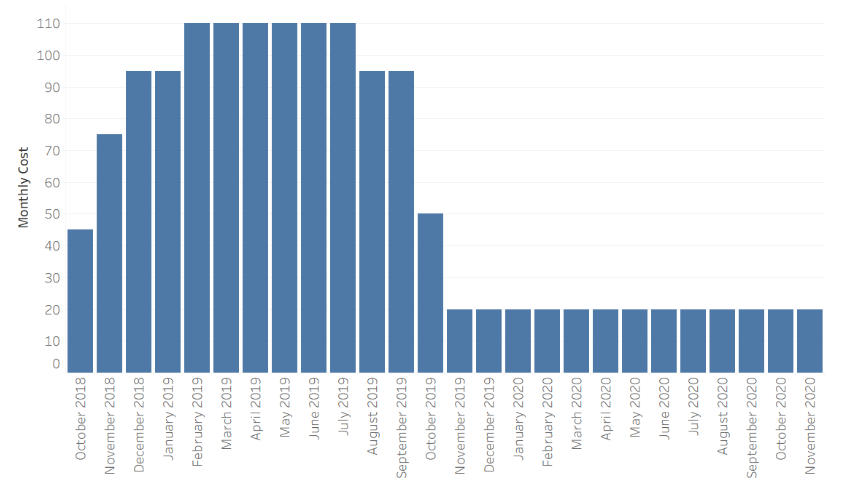
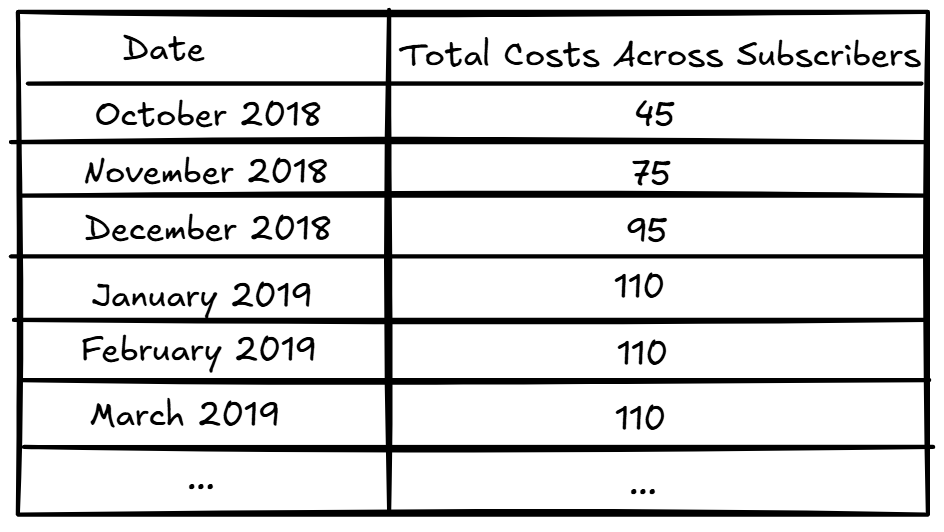
Suppose we want to know, for each month of the year, the total subscription costs across all subscribers:
Currently, our dataset wouldn’t let us do that! We only have four dates – if we tried to plot them, they would just appear as four bars.
Instead, we need a dataset where every month within the relevant time period has its own row, along with an associated value representing the total amount paid by all active subscribers in that month:
There are multiple ways to achieve this. Here is one approach using Tableau Prep:
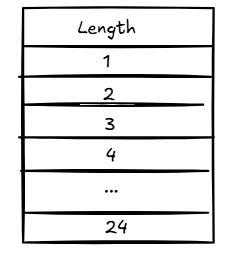
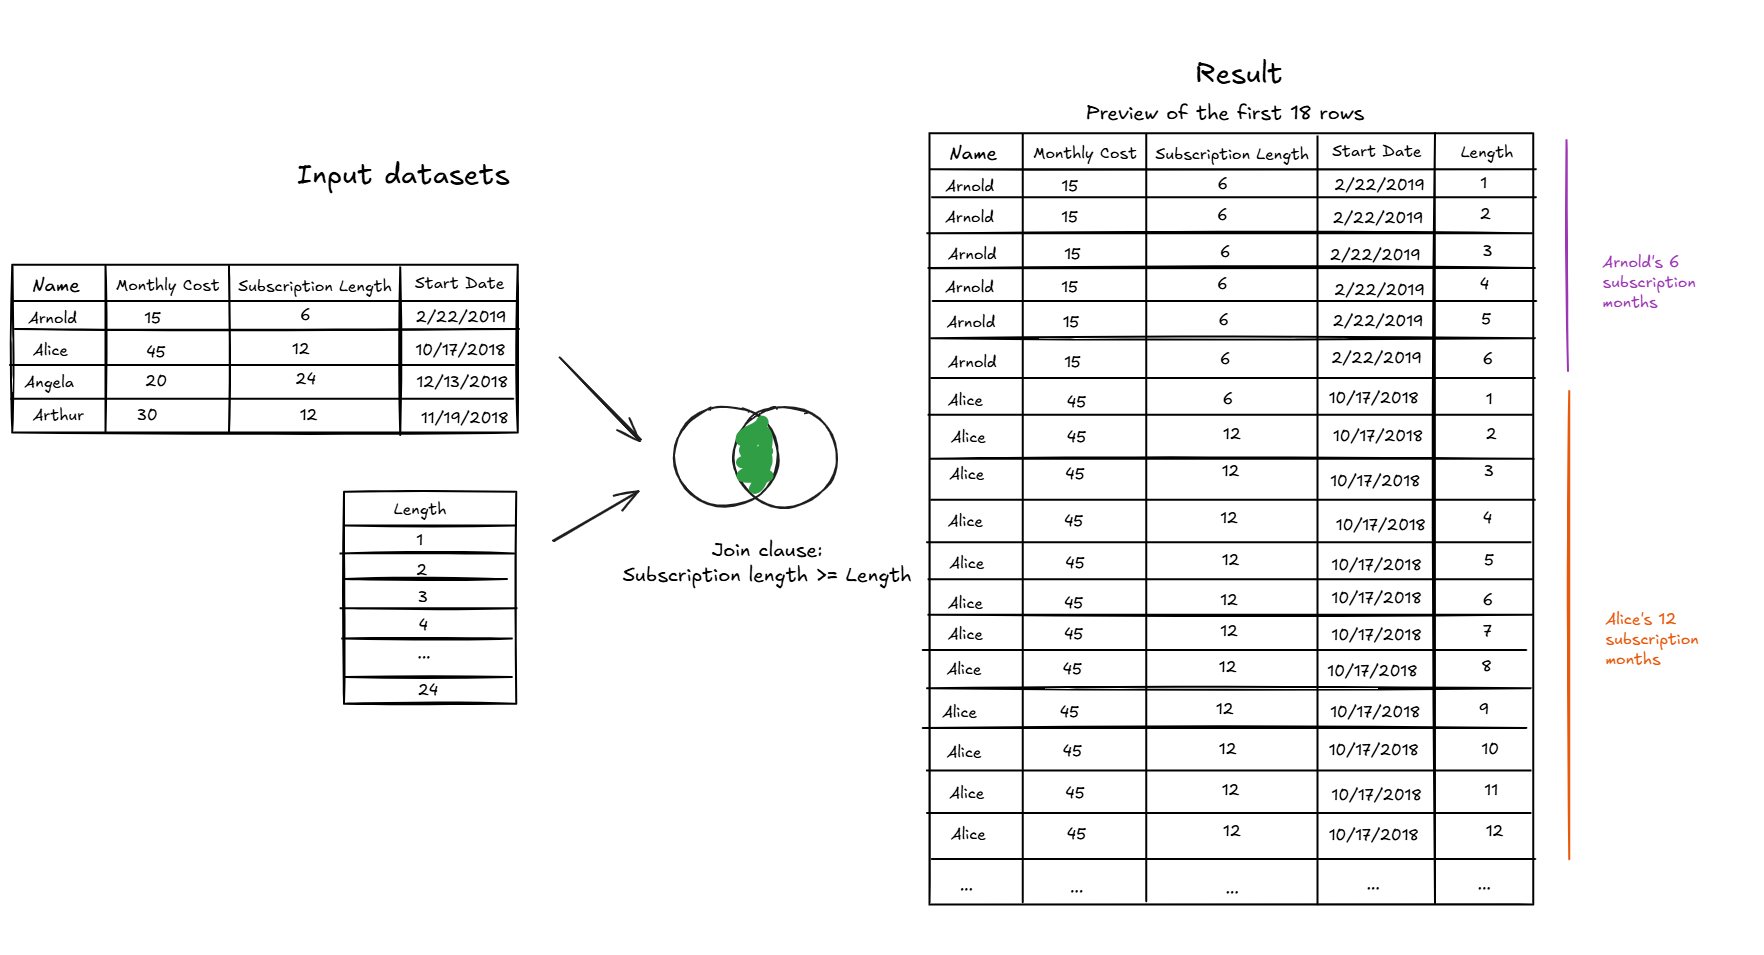
- Create data scaffold: Start by creating a new spreadsheet. Add a column called “length” and populate it with the numbers 1 through 24 (since 24 is the maximum subscription length across all subscribers; adjust thus number according to your needs). This spreadsheet will serve as your scaffold.
- Set up Tableau Prep: In Tableau Prep, connect to both your original subscriber dataset and the scaffold dataset.
- Join the two datasets: At this point, we want to join the two datasets to “stretch out” each subscriber’s record over time. Instead of one row per subscriber, this step creates one row for every month a person was subscribed.
Here’s the tricky part: when joining the datasets, you won’t use the usual = operator. Instead, you’ll use the “>=” (or the “<=” operator depending on which dataset is on the left/right): Subscription length >= Length
This allows each subscriber to join to all scaffold values up to their subscription length. For example, since Angela’s “subscription length” is 24 months, her record will join to scaffold values 1 through 24, producing 24 monthly rows for her subscription.
Without this non-equality join, you wouldn’t be able to create the repeated monthly records needed for month-by-month analysis.
- Add a “Payment Date” column: Since each row now represents a payment made in a different month, we need a date field that indicates which month each payment corresponds to. We can do this using the DATEADD function, which shifts the subscription start date forward by a specified number of months: DATEADD('month', [Length]-1, [Start Date])
This calculation adds the appropriate number of months to the start date to generate a unique payment date for each row.
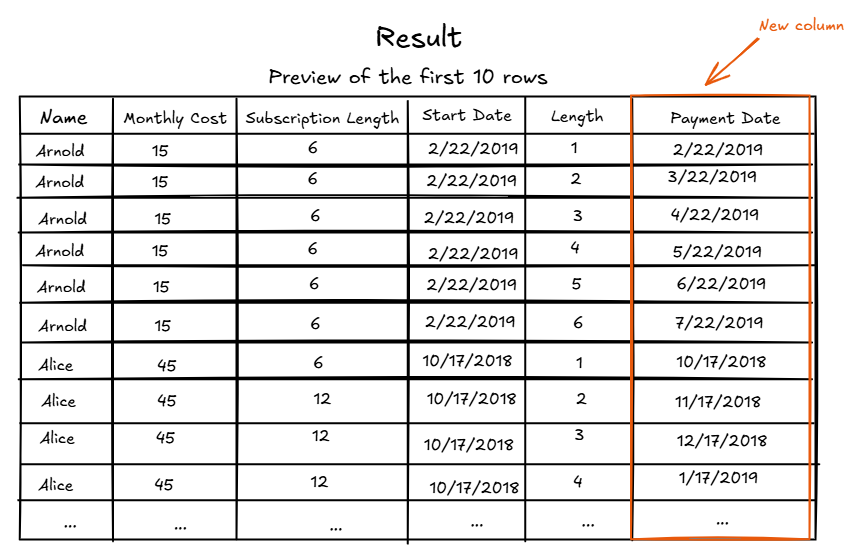
Note that we use [Length] - 1 rather than just [Length] because the first payment occurs in the same month as the start date. Subtracting 1 ensures that the first row aligns with the start month, the second row with the following month, and so on.
- Export and apply aggregations: At this point, you can export the dataset or the cleaned dataset in Tableau Desktop, aggregate by payment month, and plot the total monthly costs for each month.
Success!