


Day 2 of Dashboard Week is underway!
During this training week, we’re given a prompt each morning and challenged t0 complete a dashboard by 3 pm.
Today's topic is: Web scraping! More specifically, we were tasked with scraping the Great British Bake Off website using Alteryx and building a dashboard.
I wanted to create a recipe recommender tool where users could input certain criteria (e.g., dietary limitations) then view a set of random recipes that matched their criteria.
Here’s how I approached the project in Alteryx:
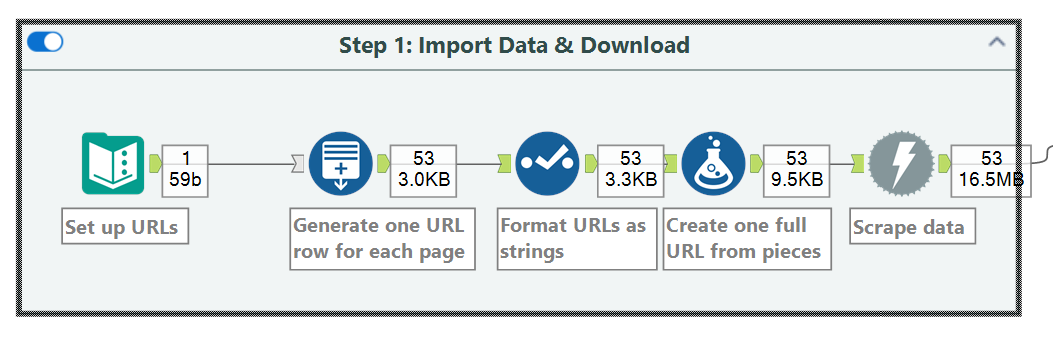
First, I imported the data
I started by creating a text input containing all the URLs I wanted to scrape. In total, there were 53 pages, so my table consisted of 53 rows, each with a corresponding page URL.
Then I used the Download tool to pull in the actual data.
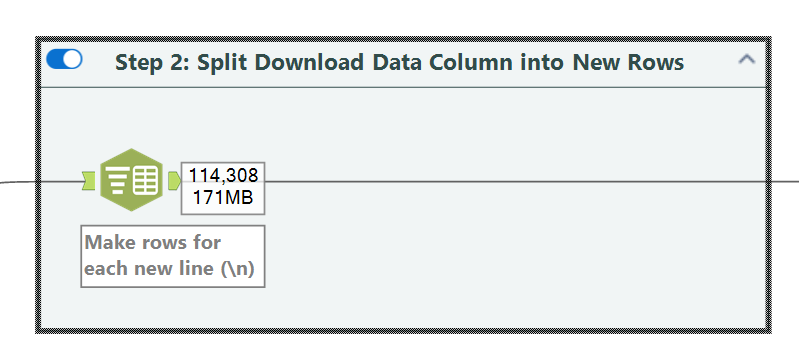
Next, I made every recipe its own row
At this point I had 53 rows of data, where each row contained all the different recipes from a single page, in a huge block of text. I wanted to break up this huge block, both to (1) remove all the unnecessary info and (2) to make every row in the table be its own recipe.
To achieve this, I used the Text to Columns tool (somewhat confusingly named, because it can also split text into rows) and applied the delimiter \n so that each line became its own row.
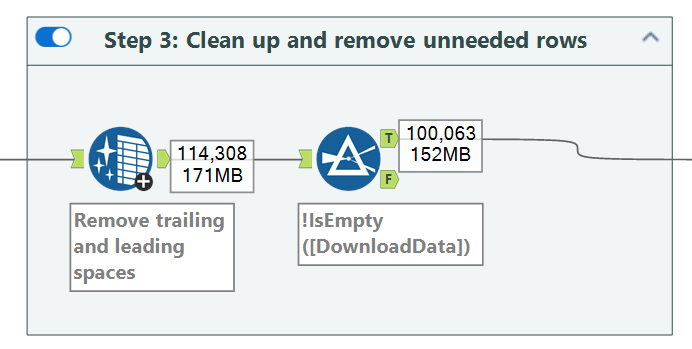
I then performed data cleanup to remove unnecessary rows and trim leading and trailing whitespace.
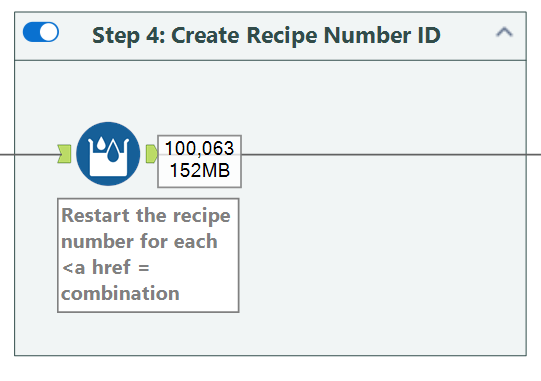
After that, I used the Multi-Row Formula tool to create a Recipe Number (aka a recipe ID) to group related lines into individual recipes. The logic I used was:
IF CONTAINS([DownloadData], "<a href=")
THEN [Row-1:Recipe Num] + 1
ELSE [Row-1:Recipe Num]
ENDIF
This let me increment the recipe number whenever a new recipe link appeared:
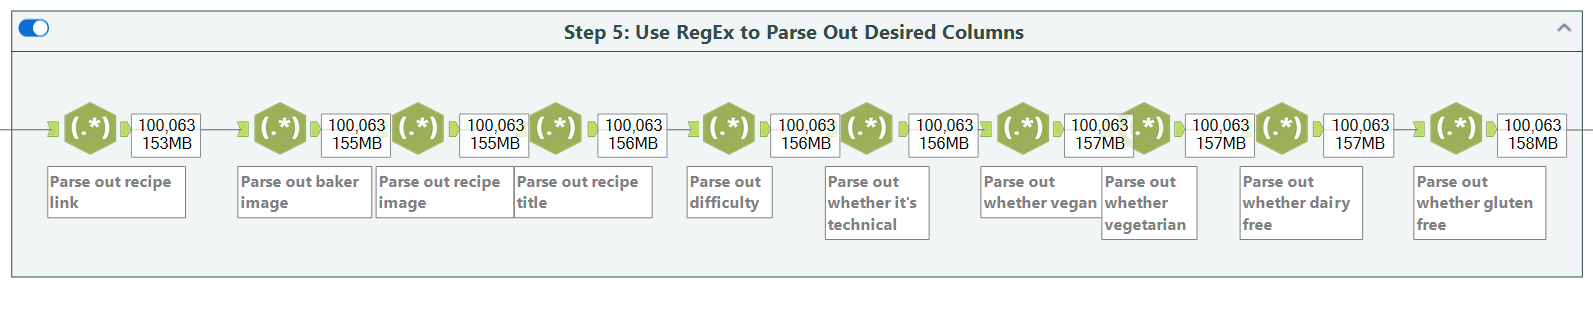
Next, I applied a series of regex operations to extract the info I wanted, including:
- Recipe link
- Baker image
- Recipe image
- Recipe title
- Difficulty level
- Whether the recipe was technical
- Dietary tags (vegan, vegetarian, dairy-free, gluten-free)
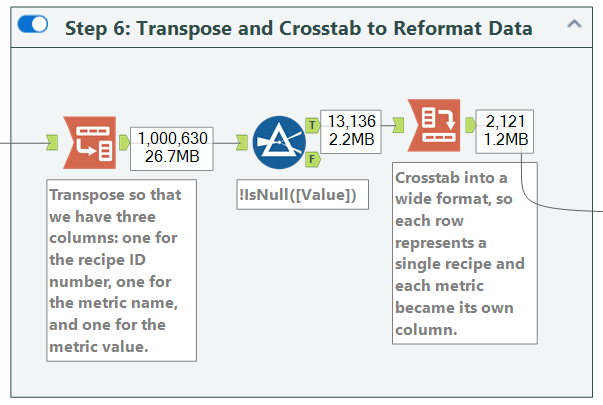
To reshape the data, I used a combination of Transpose and Crosstab tools. The Transpose tool converted the dataset into a long format with three columns: recipe number, metric name, and metric value. Then, the crosstab tool transformed it back into a wide format, where each row represented a single recipe and each metric became its own column.
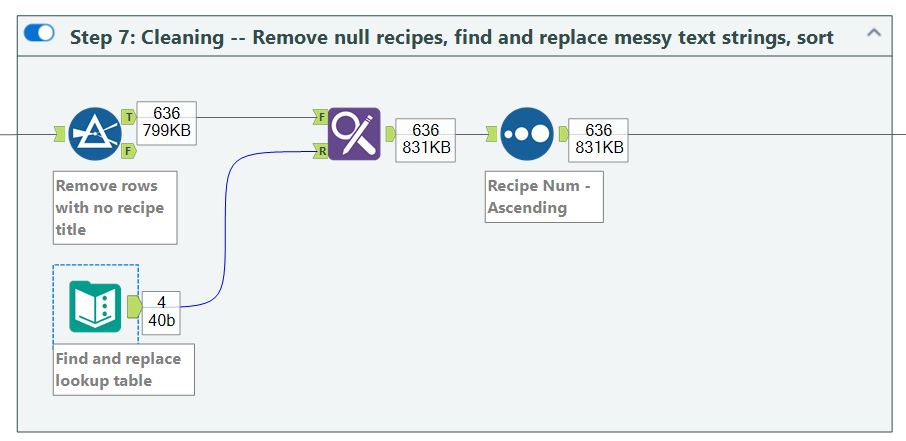
I performed additional cleanup by removing null recipes and fixing formatting issues (for example, converting HTML character codes like ‘ into proper apostrophes using find & replace).
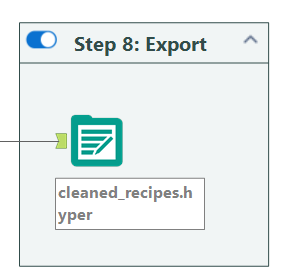
I then exported the data.
Finally, I exported the images
To download recipe images, I followed a helpful tutorial from Robbin Vernooij (thank you Robbin!), which demonstrated how to download images as shapes, upload them into Tableau Desktop, and link them back up to my recipes.
At this point, I moved into Tableau to build the dashboard.
And that's a wrap on day 2!