


Visuals are a powerful tool for communicating complex ideas and data in a clear and compelling way. However, simply including an image or chart in a blog post may not be enough to convey the full depth and richness of the information being presented. This is where embedding visualizations in a blog post can be incredibly useful by helping readers interact with the data, explore it in more detail and gain a deeper understanding of its nuances.
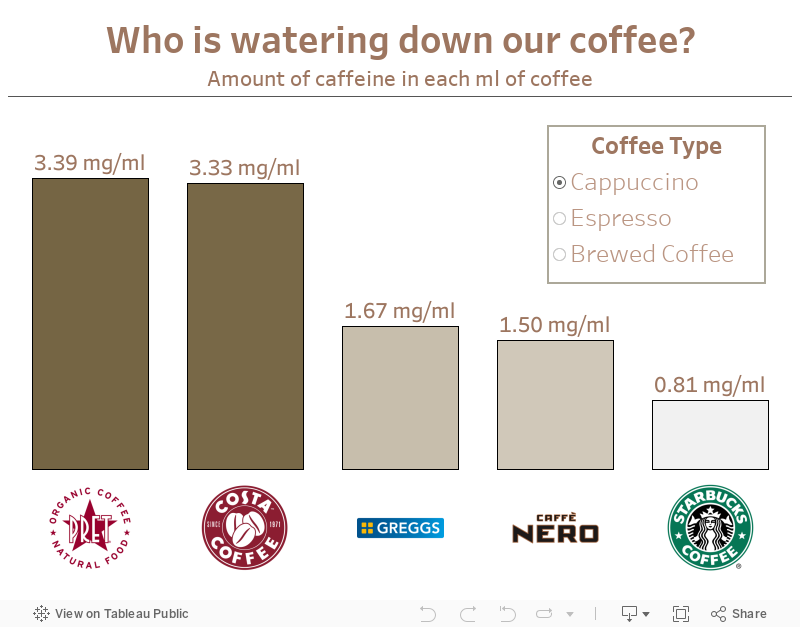
Below, you will find a simple interactive visualization I created to explore the caffeine concentration of different types of coffee in 5 major coffee chains. You can play around with the visualization!
This visualisation is designed to be viewed on a laptop
In this blog post, I will show you how to easily embed a visualization in your own blog posts!
Step 1: Copy your embed code
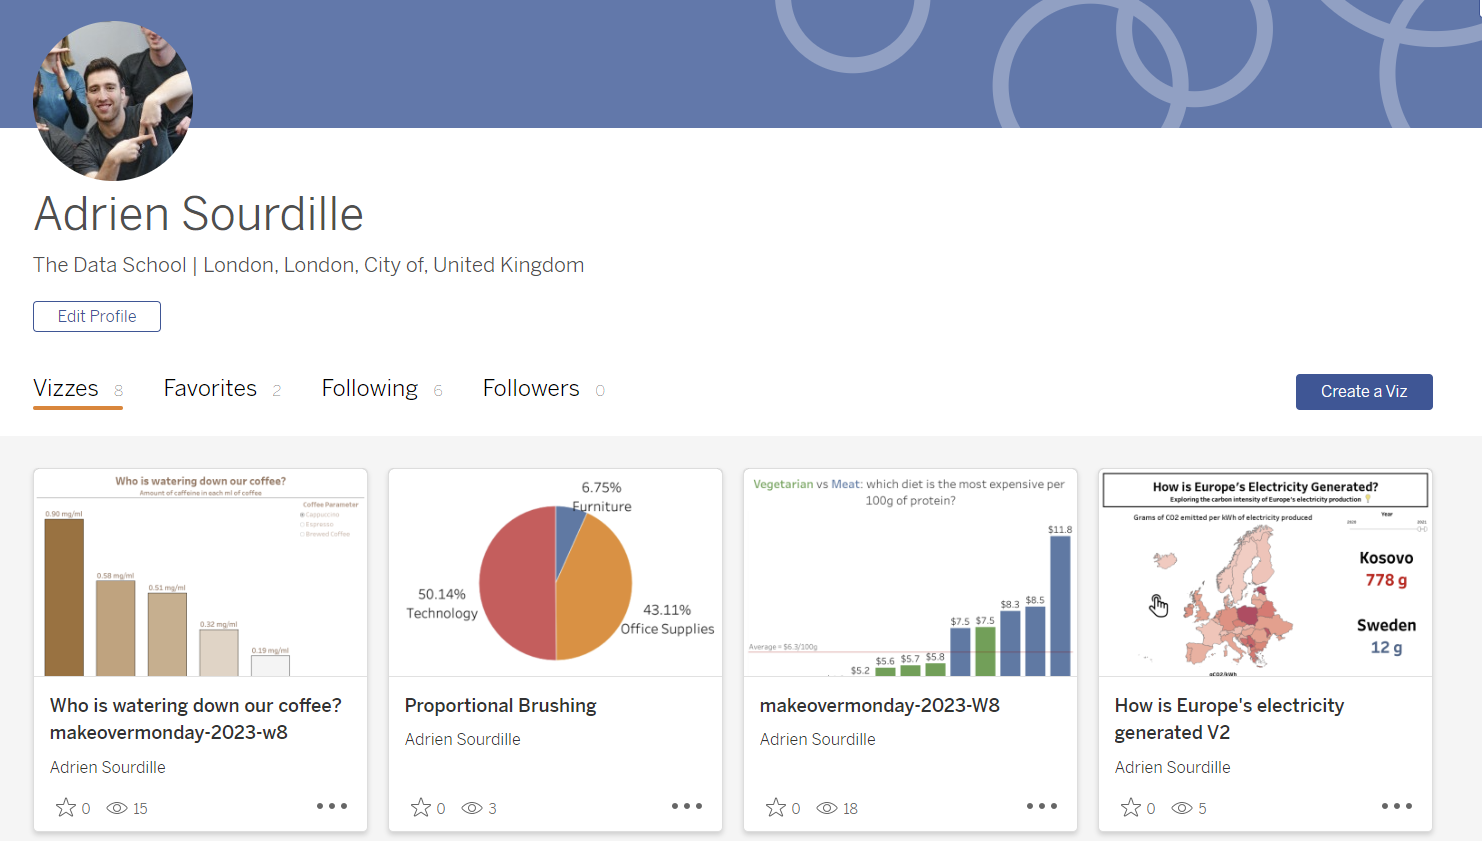
- Find the visualization you want to share in Tableau Public. Here I just went to my tableau public profile and clicked on one of my publicly available visualizations.
- Next, click on the 'Share' button on the top right of your screen.
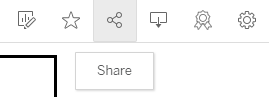
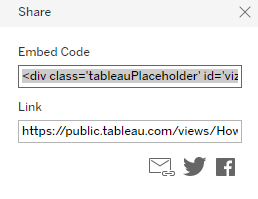
- Now copy the 'embed code' that appears in the share box.
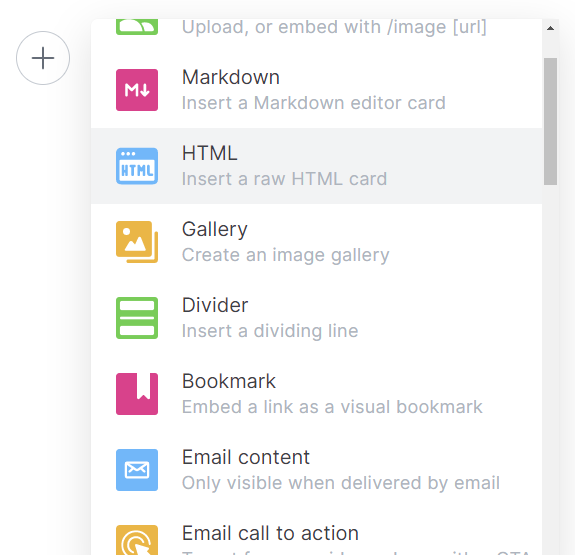
Step 2: Insert a raw HTML card
When writing your blog on ghost, you should see a (+) button appear when going to the line. Click on that button and select 'insert a raw HTML'.
Step 3: Paste your code
Your HTML card should now look something like that.
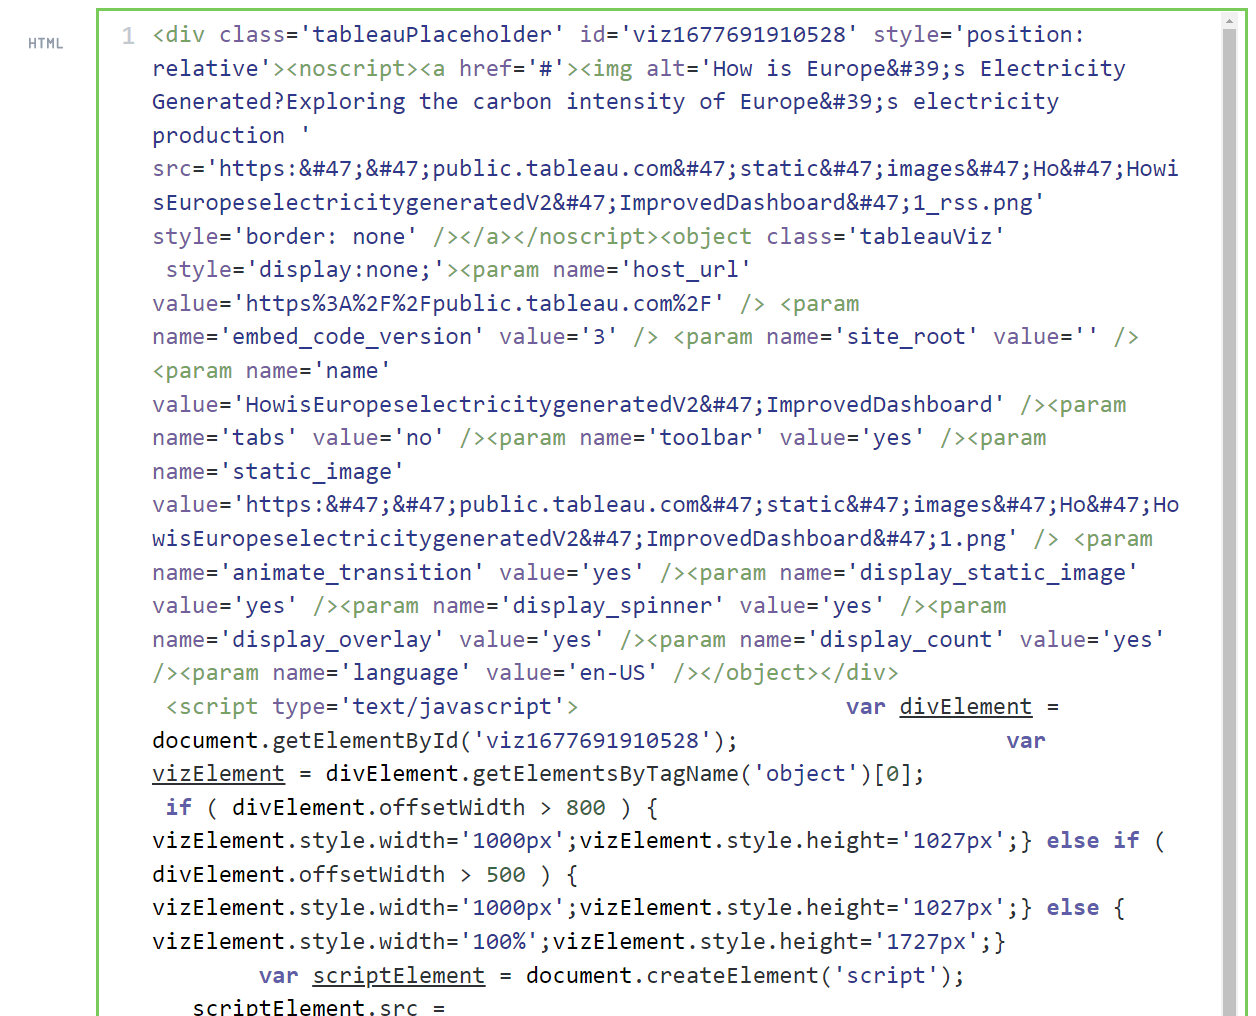
Simply click out of the box to embed your visualization.

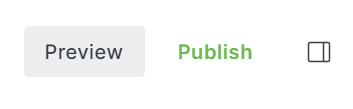
To view your visualization and interact with it, you can click on the preview button on the top right of your blog.
Congratulations, you just embedded your first tableau vizualisation to your blog!