


Although the attribute function is very popular and is often used to fix aggregation errors in our table calculations, rare are the people who understand what ATTR() actually does. In this blog, I will explore the attribute function and explain when and how to use it effectively.
What is the attribute function?
One of Tableau's key features is the ability to create calculated fields, which are custom calculations based on the data in a given worksheet. One of the predefined functions that Tableau offers is the ATTR() function, which can be used to return the unique value of an attribute for a given dimension.
In its simplest form, the attribute function can be expressed as:
IF MIN ([dimension]) = MAX ([dimension])
THEN MIN ([dimension])
ELSE "*"
END
In plain English, the function compares all the values from each grouped record in the underlying data and, if the values are all the same, it returns that value. Otherwise, it will return an asterisk (*). In essence, this task could almost be accomplished by a simple MIN() or MAX() function except for the fact that the attribute function is looking for groups of identical values and separating them from groups of unidentical values.
When and how should I use it?
Creating Calculated Fields: To make computations based on a distinct attribute value, use the ATTR() method in calculated fields. The unique value of a product ID, for instance, can be obtained by creating a calculated field that uses the ATTR() method, and a computation can then be done using that value.
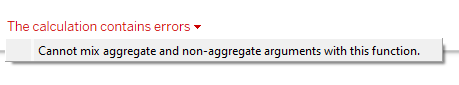
The attribute function enables us to fix the common calculation error that arises when trying to mix aggregate and non-aggregate arguments in a function. Indeed, the attribute function turns non-aggregate measures into aggregate measures, enabling your table calculation to run with no error.
For example, let's say you have a data set that includes a non-aggregate measure called "Sales" and a dimension called "Region" that represents the region where each order was placed. If you want to create a calculation that shows the unique value of the "Region" dimension when the sum of sales is higher than 50 000$ you could use the ATTR() function to turn the non-aggregate measure (Region) into an aggregate measure.

For further explanation, have a look at this video where Zen Master Chris Love shows three examples (min, max, and attr) of how to fix the 'aggregation error'.
Aggregating Data: You might want to combine data to produce a summary when dealing with data that has multiple values connected to a particular component. For instance, you could use the ATTR() method to yield the unique value of the customer name and then aggregate the data based on that unique value if you have a dimension that reflects customer names and numerous customers have the same name.
Creating visualizations: The ATTR() method can be helpful because it returns a distinct number for each dimension. For instance, you could use the ATTR() method to yield a customer name's unique value, and then you could make a visualization that displays the total revenue for each distinct client.
In conclusion, the ATTR() function in Tableau can be a powerful tool when working with dimensions that have multiple values associated with them. It allows you to return the unique value of an attribute for a given dimension and can be particularly useful when performing calculations or building visualizations based on that unique value. However, it's important to use the ATTR() function with caution and to consider the context in which it is being used. When used appropriately, the ATTR() function can help you aggregate data, create calculated fields, and build visualizations that provide meaningful insights.