A bump chart is a data visualization that shows changes in the ranking of a set of items or entities over time. It is useful for analyzing and communicating changes in relative position and is commonly used in sports, finance, and business. Bump charts allow you to quickly see which items have improved or declined in rank and by how much so consider using it for tracking performance or rankings over time.
In this blog, follow along as I create a bump chart in Tableau using the superstore sample dataset.
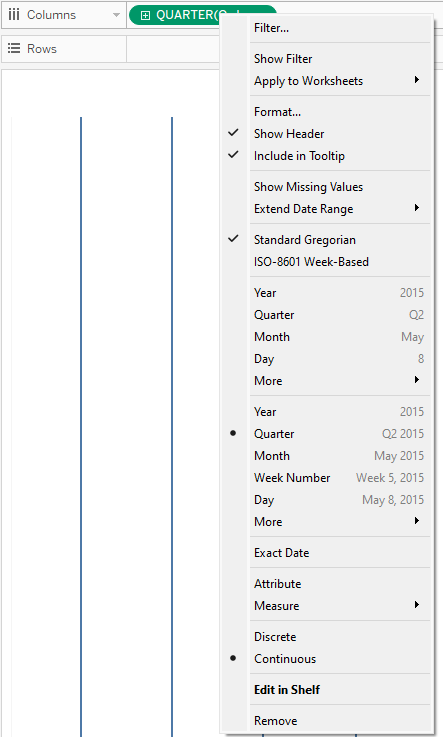
Step 1) Drag your date on columns as a continous field.
Step 2) Drag the SUM (Sales) on to rows and sub-categories on to "color".
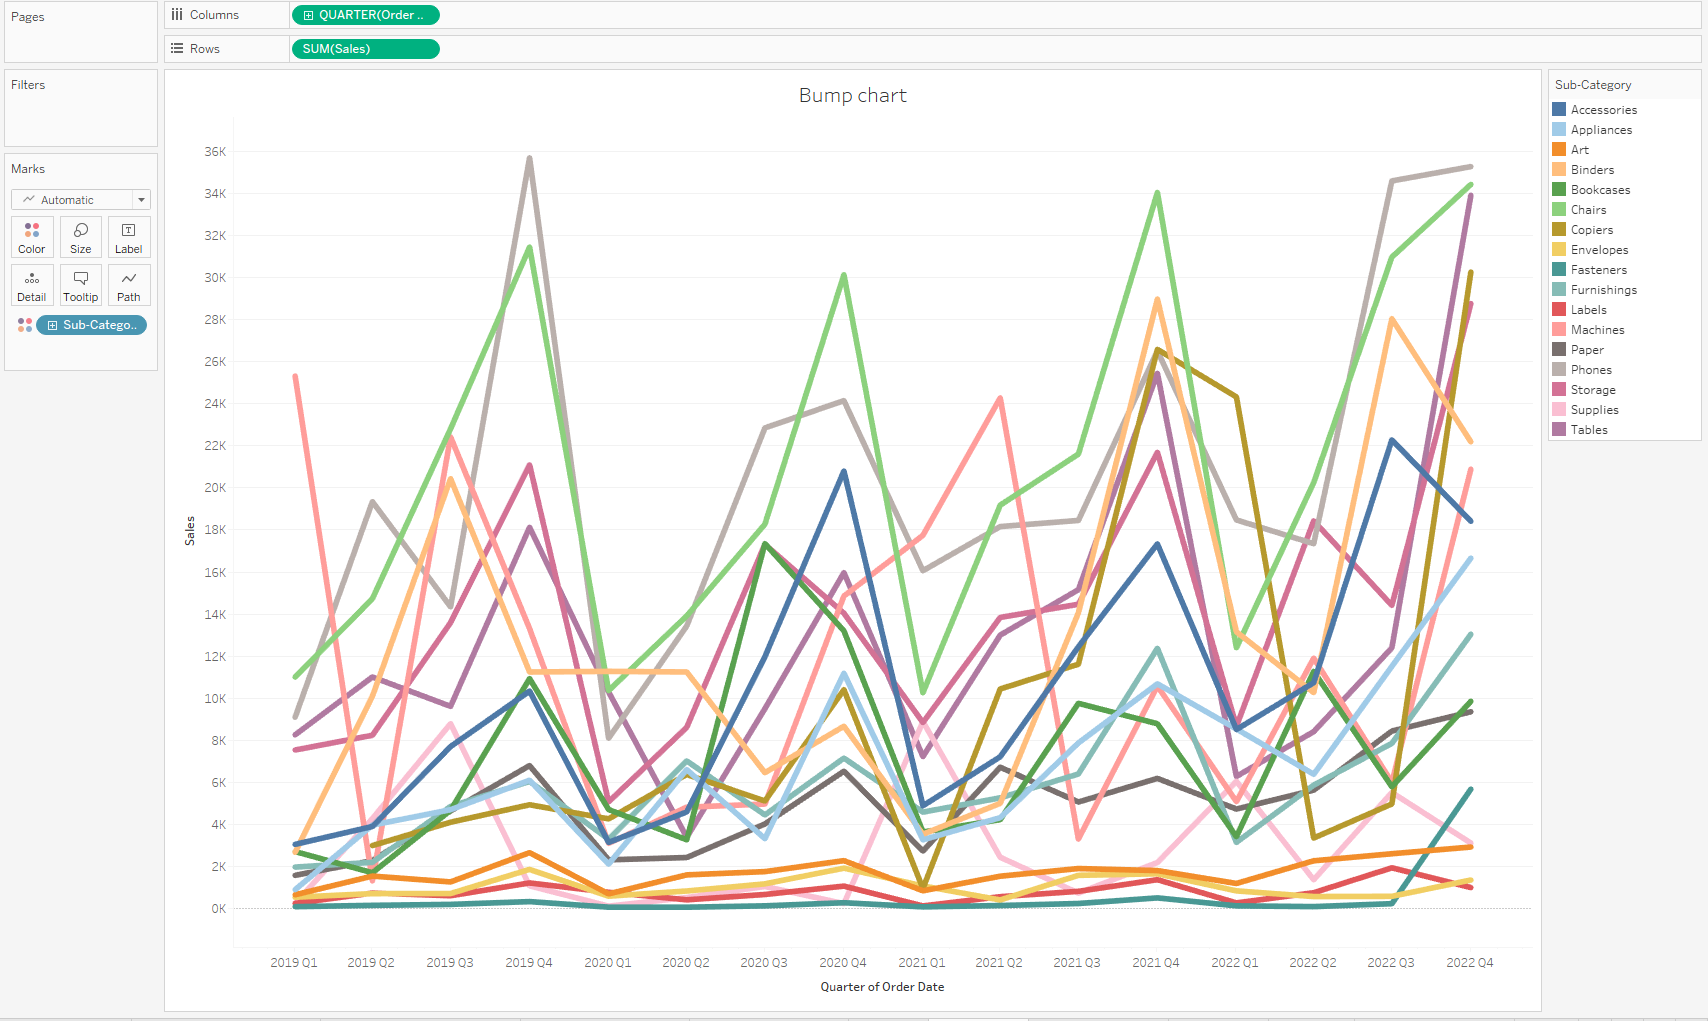
You now have a bunch of entangled lines. It is time to put some order in this mess!
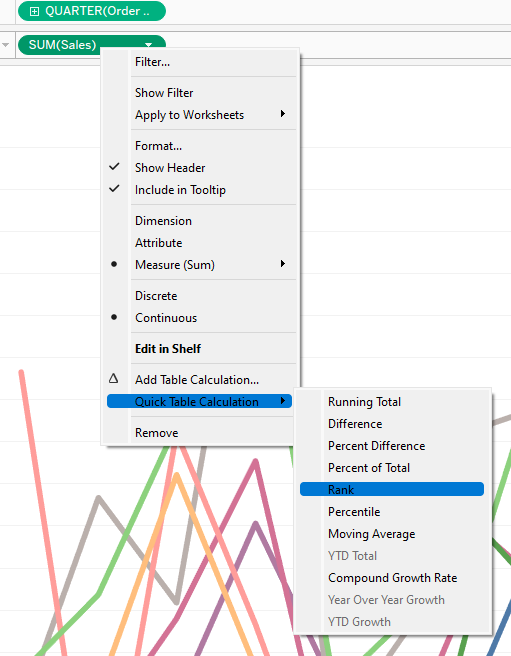
Step 3) Right click on SUM(Sales), choose "quick table calculation" and "rank".
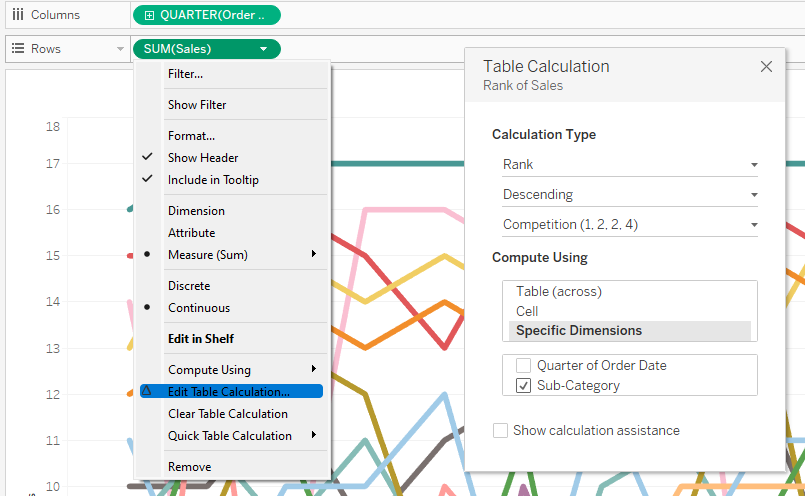
Step 4) Edit your table calculation and, for each "Quarter of Order Date", compute the "Rank" (descending) by "Sub-Category".
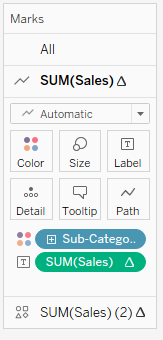
Step 5) Duplicate your table calculation
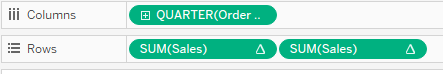
Tip: press control and drag your table calculation (sum of sales) next to itself. This will create another table calculation in your row and another identical line graph under your original graph.
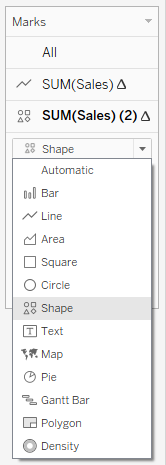
Step 6) Change your second mark from "Line" to "Shape".
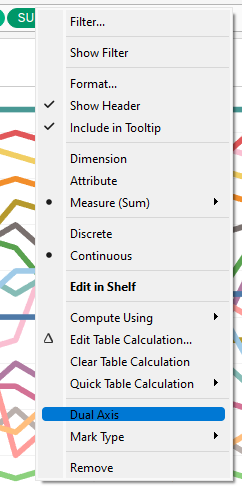
Step 7) Create a dual axis to combine your line graph and your shapes
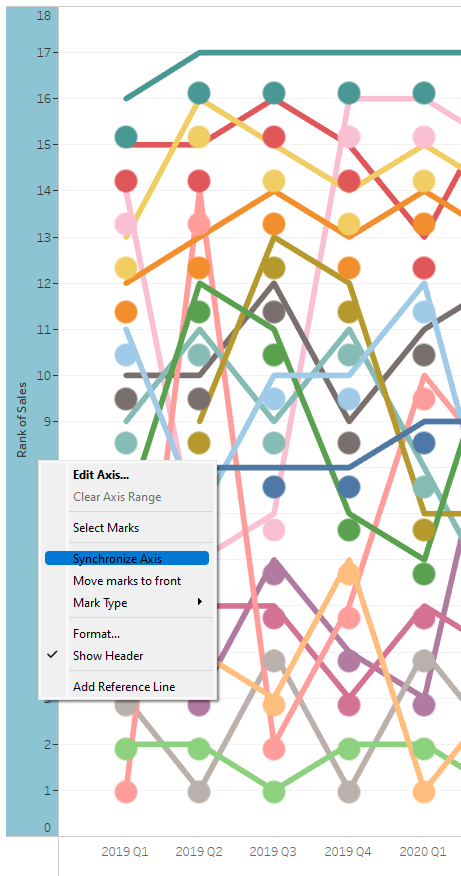
Step 8) Right click on any of the axis and choose "Synchronise axis"
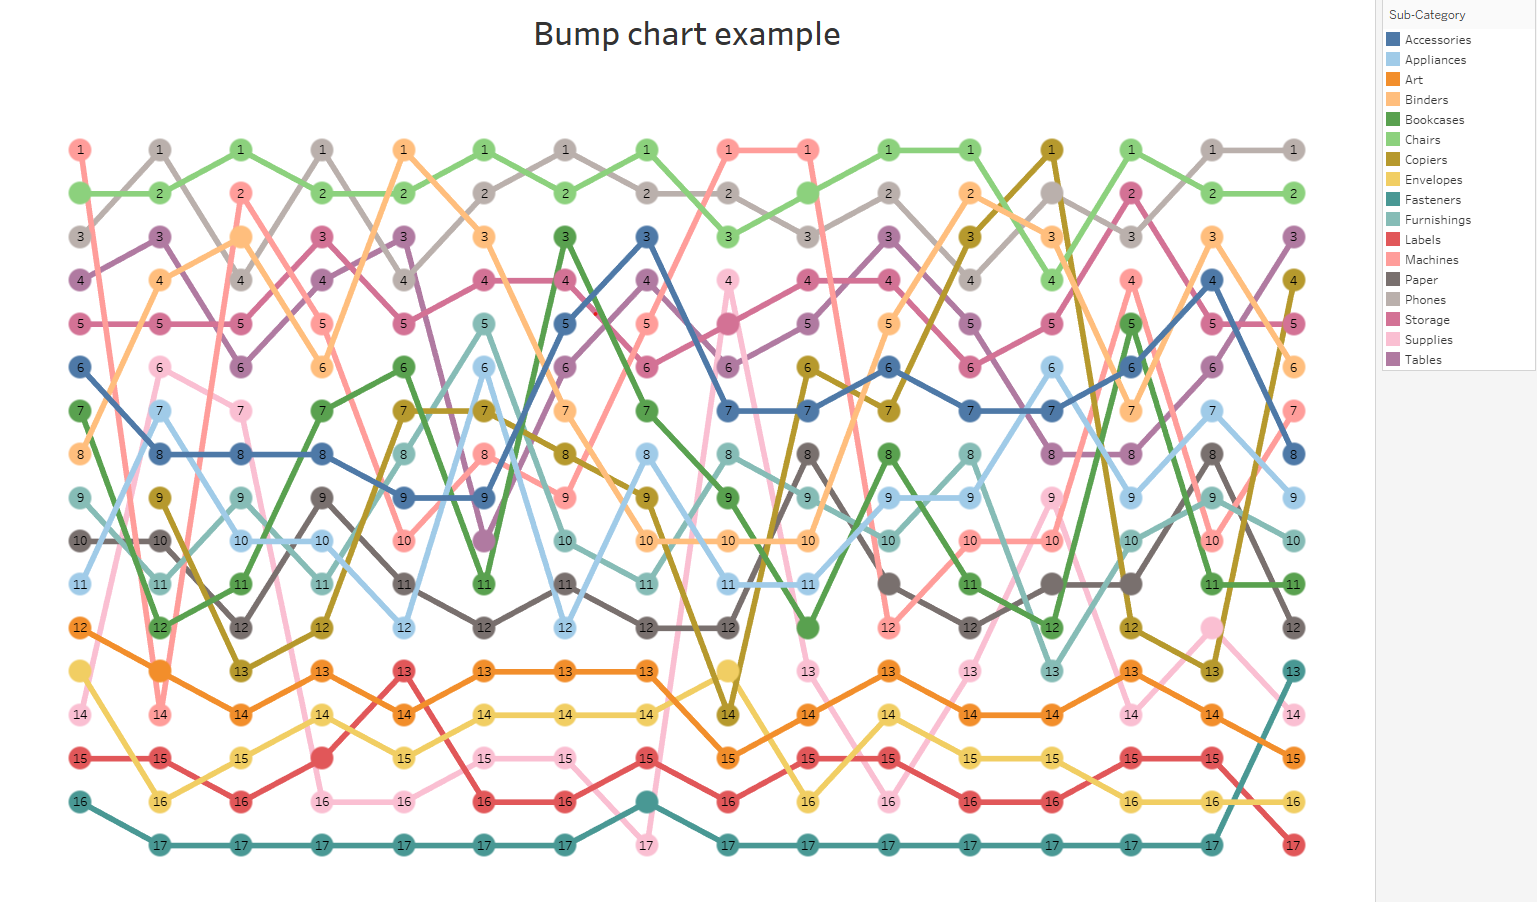
Step 9) Drag your table calculation on your line graph "Label" and format your label to show the ranking for each sub-category and quarter.
Step 10) Right click on any of your axis and click on "Edit axis". Then select "Reversed" under "Scale".
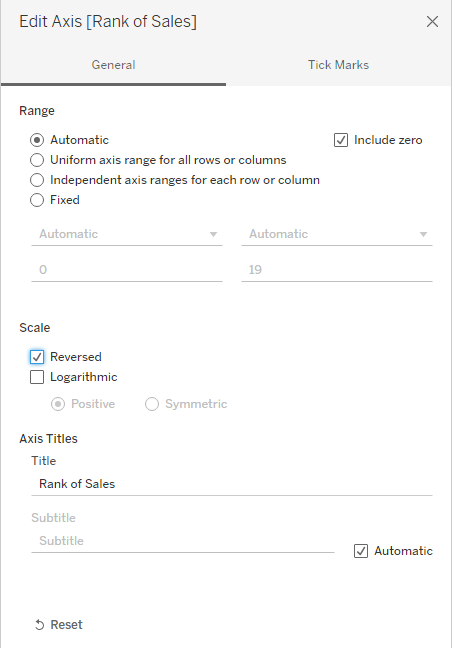
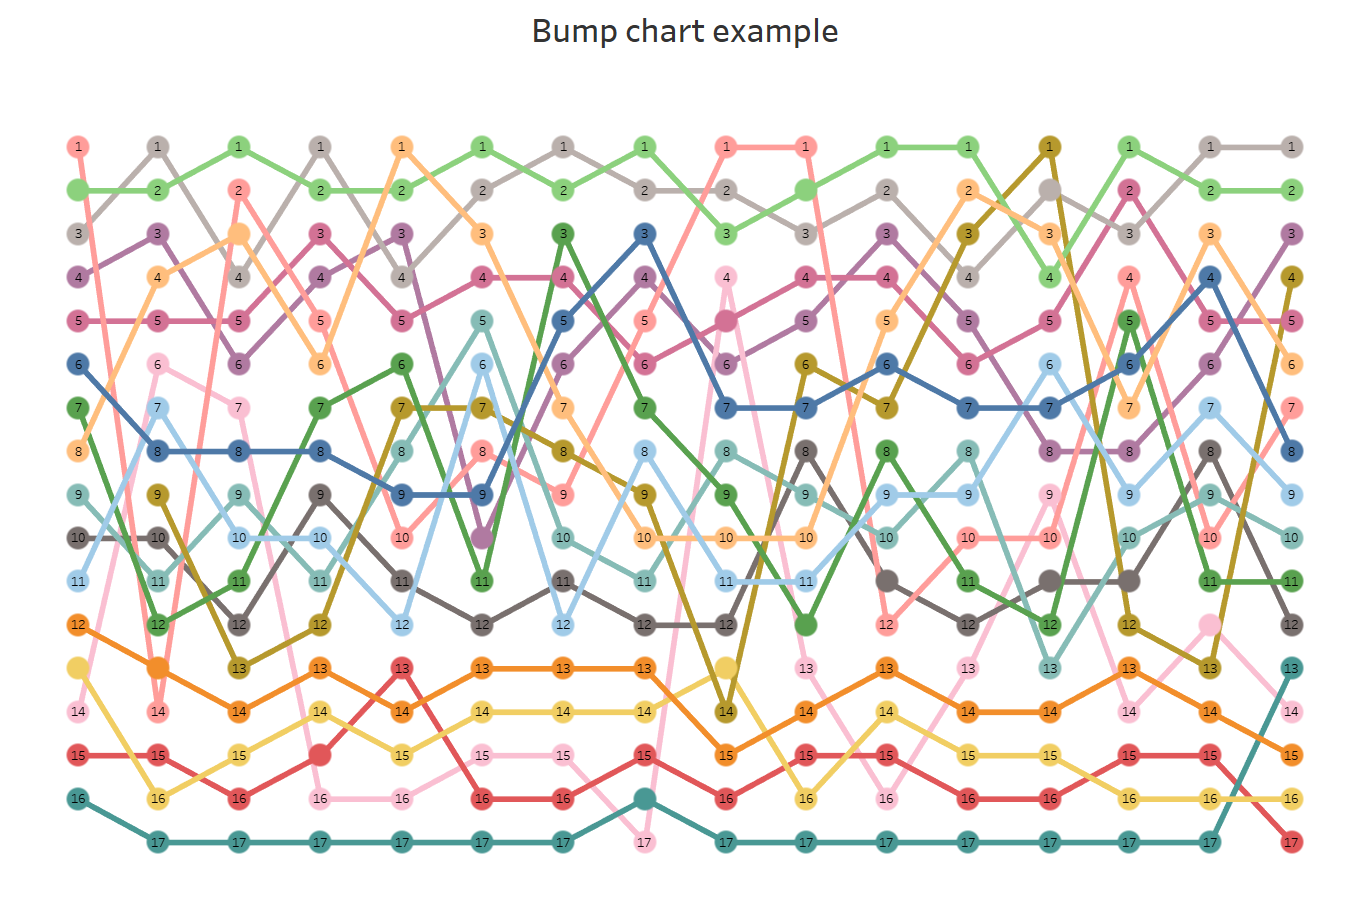
This way, you get the most sold sub-categories on the top of your chart and the least sold sub-categories at the bottom of your graph.
Last but not least, enjoy the result!